|
|
|

 The phosphorus cycle. Numbers are 1012 g P or fluxes as 1012 g P per year (data from Schlesinger 199
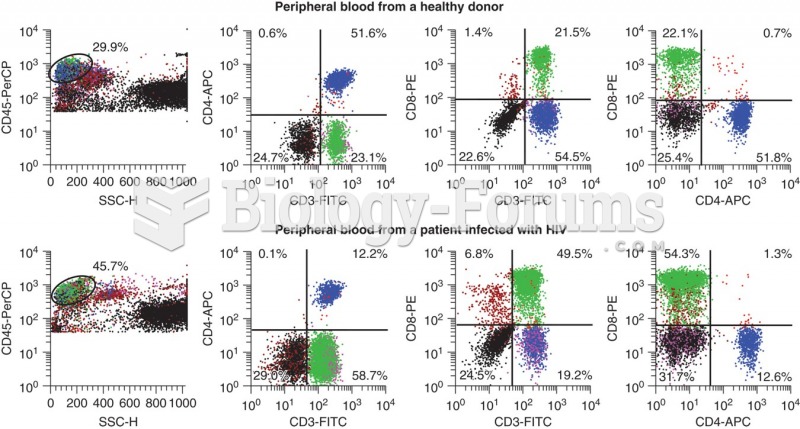 Flow data for a healthy donor (top panel) and a HIV positive patient. CD3 is a T-cell marker, CD4 is ...
 How to calculate the mean for grouped data
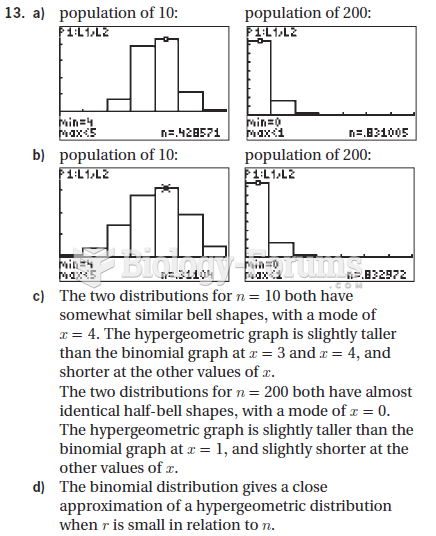
 Data management questions
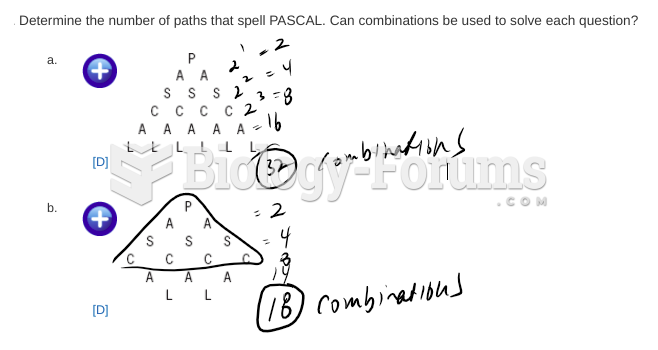
 Data management short answer q
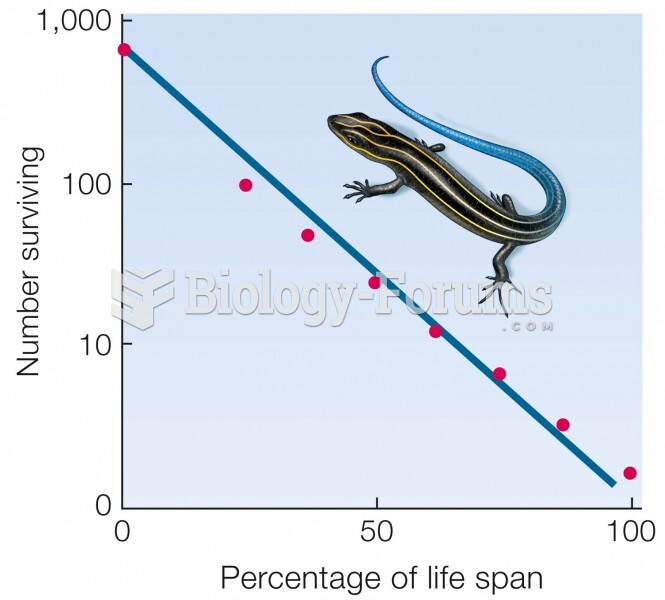 Type II curve. Mortality does not vary with age. Data for five-lined skink (Eumeces fasciatus).