This topic contains a solution. Click here to go to the answer
|
|
|

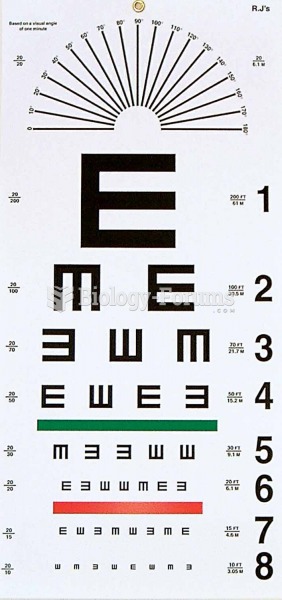 Snellen chart.
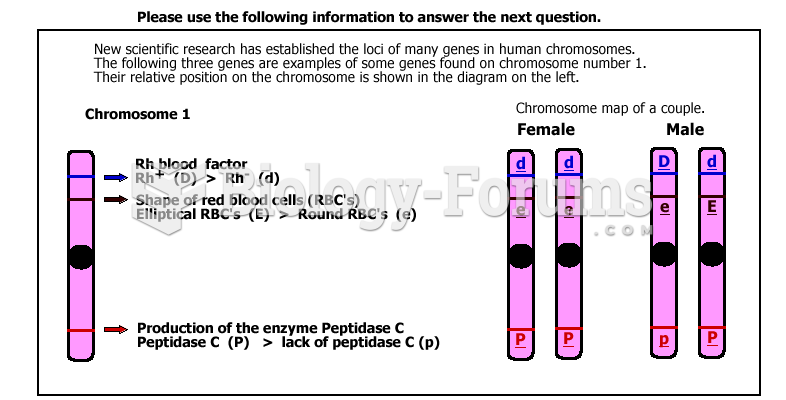 Chart to answer QN
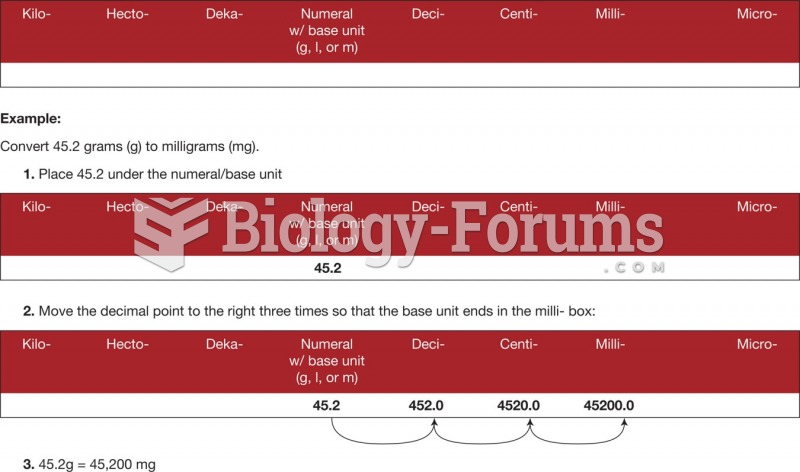 Metric conversion using the place value chart.
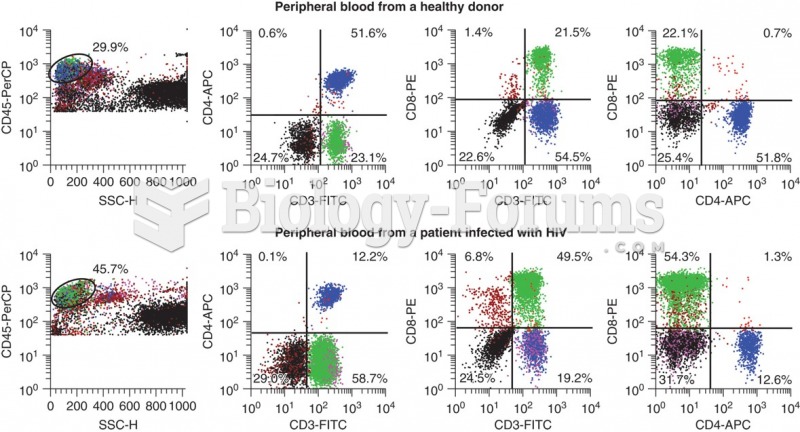 Flow cytometry data that shows the differences in CD3+ CD4+ cells that occur with HIV infection. ...
 Finding the graph of a Parabola using certain values
 Graph Liters per Hour