In a report, when you want to visually display the relationships between parts and a whole, you should use a:
A. pie chart.
B. histogram.
C. line graph.
D. flow chart.
Question 2
Which of the following practices is best avoided when preparing a business report?
A. Placing the executive summary after the introduction section
B. Including the name of the person for whom the report is prepared in the title page
C. Drawing conclusions for the report from personal observations
D. Including information in the body of the report, about how the research was done

 The Principal Parts of a Multipolar Neuron
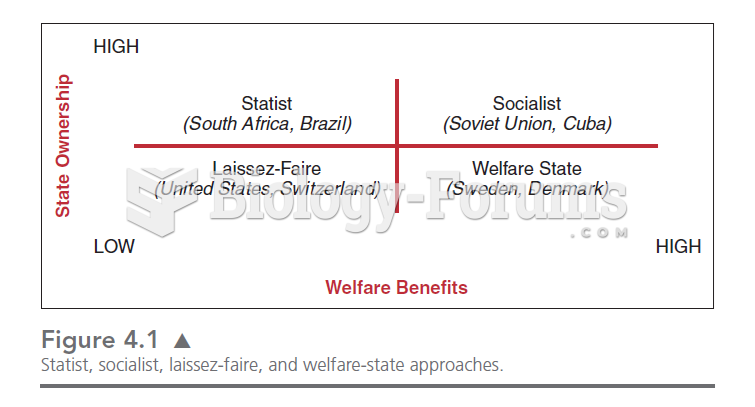 This chart illustrates the four quadrants in which we can place the relationships between the state
 Ugonachomma display figure, Igbo, Nigeria.
 The Kinsey Report on American Women
 Long-term relationships, especially those who are married, having a child
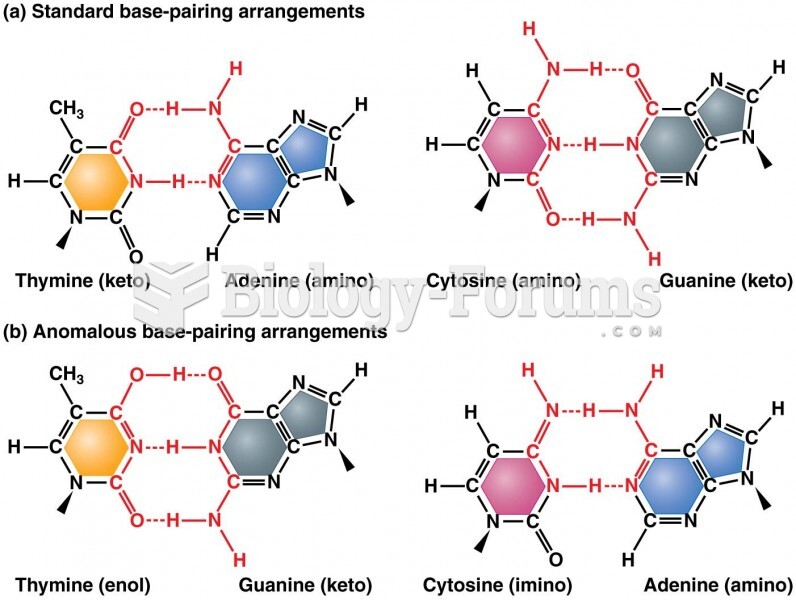 Standard base-pairing relationships