This topic contains a solution. Click here to go to the answer
|
|
|

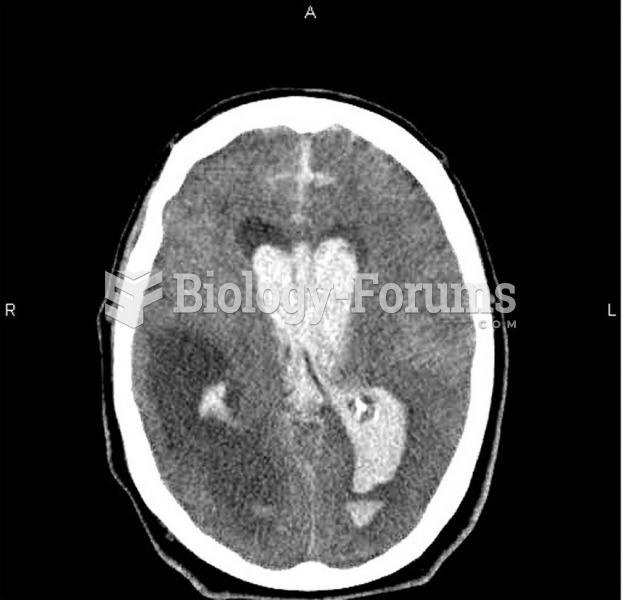 CT scan of the head shows a massive bleed with a midline shift.
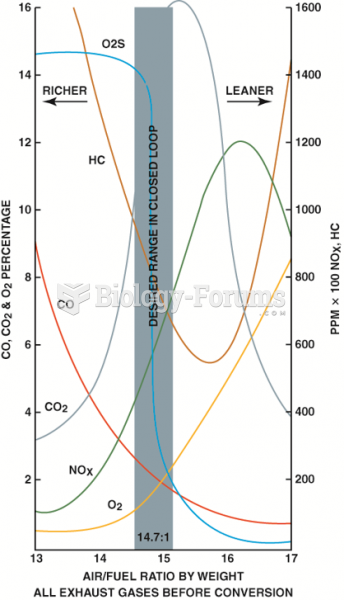 Exhaust emissions are very complex. When the air–fuel mixture becomes richer, some exhaust ...
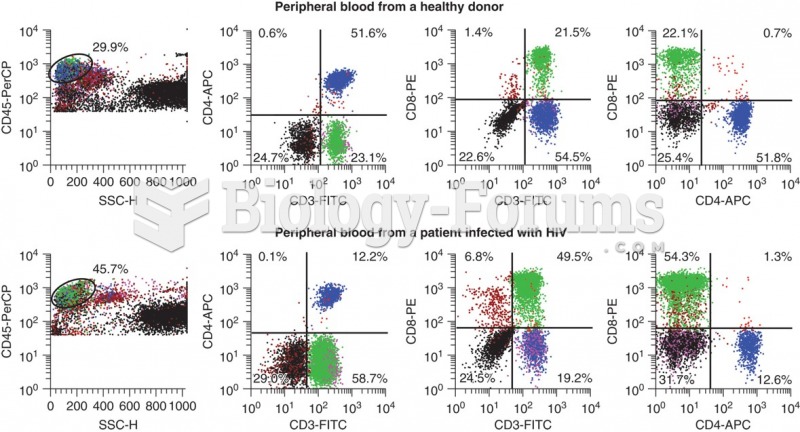 Flow cytometry data that shows the differences in CD3+ CD4+ cells that occur with HIV infection. ...
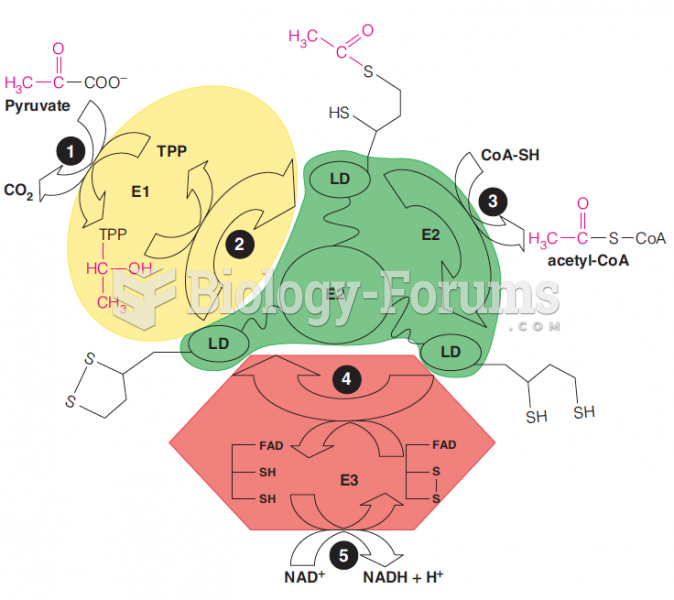 Mechanisms of the pyruvate dehydrogenase complex
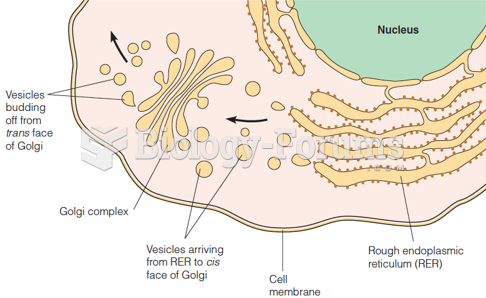 Transfer from the rough endoplasmic reticulum (RER) to the Golgi complex
 Demographic Data for Nigeria