A series of data points on a grid, continuously connected by straight lines, that display a picture of selected data changing over a period of time is called a line chart.
Indicate whether the statement is true or false
Question 2
Narrative 11-2 Solve the following problems using either Tables 11-1 or 11-2 from your text. When necessary, create new table factors. (Round new table factors to five decimal places, round dollars to the nearest cent and percents to the nearest hundredth of a percent) Refer to Narrative 11-2. Eduardo wants to have 17,500 in 9 years. Calculate how much he should invest now at 8 interest, compounded quarterly in order to reach his goal.

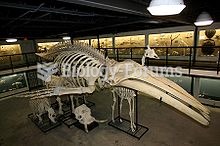 Humpback Whale Skeleton on Display at The Museum of Osteology, Oklahoma City, Oklahoma
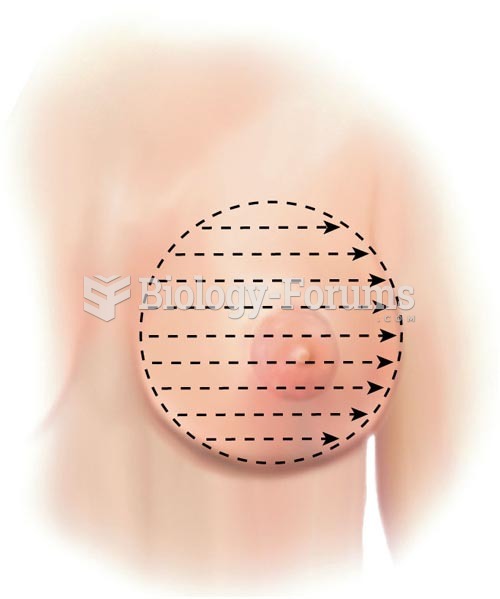 Breast Palpation Methods, Parallel Lines
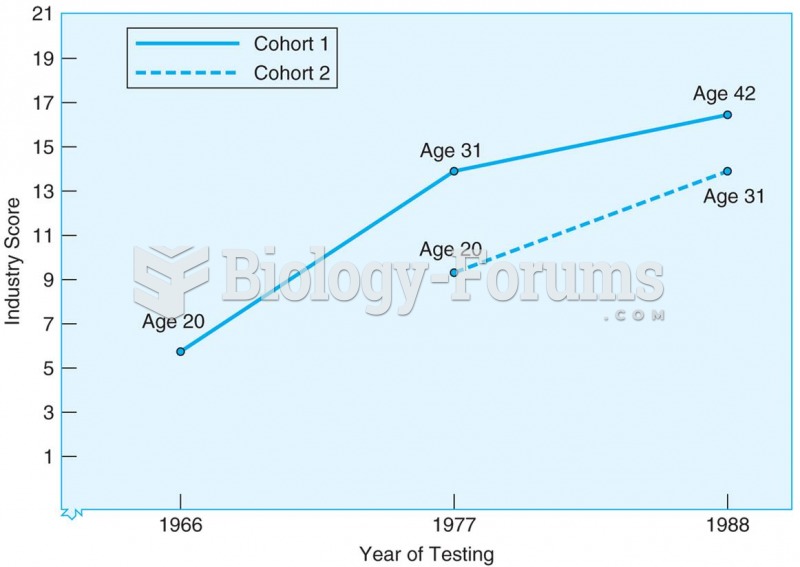 Results from sequential study of two cohorts tested at three ages and at three different points in t
 Shirin Neshat, Rebellious Silence, from the series Women of Allah.
 Eleanor Antin, Constructing Helen, from the series Helen's Odyssey.
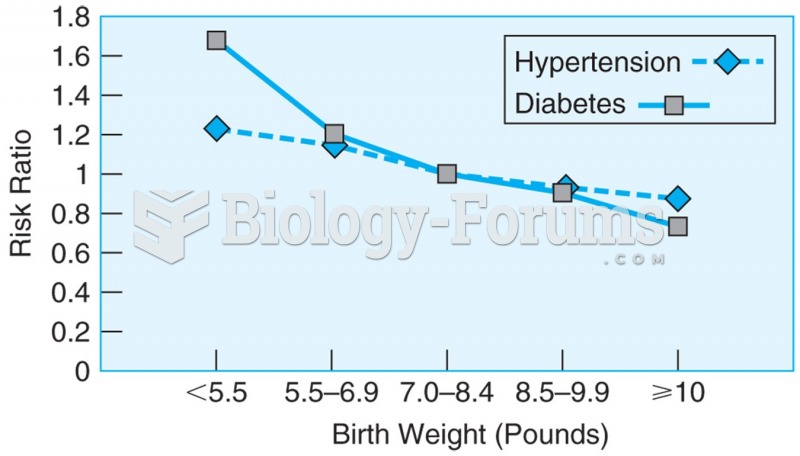 Data from more than 22,000 men over the age of 40, showing the relationship between birth weight and ...