A series of data points on a grid, continuously connected by straight lines, that display a picture of selected data changing over a period of time is called a line chart.
Indicate whether the statement is true or false
Question 2
Narrative 11-2 Solve the following problems using either Tables 11-1 or 11-2 from your text. When necessary, create new table factors. (Round new table factors to five decimal places, round dollars to the nearest cent and percents to the nearest hundredth of a percent) Refer to Narrative 11-2. Eduardo wants to have 17,500 in 9 years. Calculate how much he should invest now at 8 interest, compounded quarterly in order to reach his goal.

 2006 Data:Top 25 Substances Involved in Human Exposures
 The strange situation. The Strange Situation features a series of episodes in which (a) the mother l
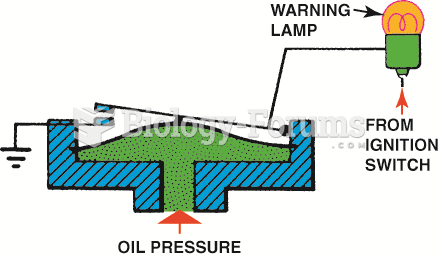 The oil pressure switch is connected to a warning lamp that alerts the driver of low oil pressure.
 Tai chi walk along straight line. From tai chi stance, shift weight to the back leg and turn the ...
 Examples of how the recessive gene for straight hair passes from parents to children
 ANSWERS TO THIS PICTURE PLEASE