A series of data points on a grid, continuously connected by straight lines, that display a picture of selected data changing over a period of time is called a line chart.
Indicate whether the statement is true or false
Question 2
Narrative 11-2 Solve the following problems using either Tables 11-1 or 11-2 from your text. When necessary, create new table factors. (Round new table factors to five decimal places, round dollars to the nearest cent and percents to the nearest hundredth of a percent) Refer to Narrative 11-2. Eduardo wants to have 17,500 in 9 years. Calculate how much he should invest now at 8 interest, compounded quarterly in order to reach his goal.

 Display Used by Murray, Boyaci, and Kersten (2006)
 Andy Warhol, San Francisco Silverspot, from the series Endangered Species
 The Ford logo on display at the 2009 New York International Auto Show.
 Differences in how we display gender often lie below our awareness. How males and females use social ...
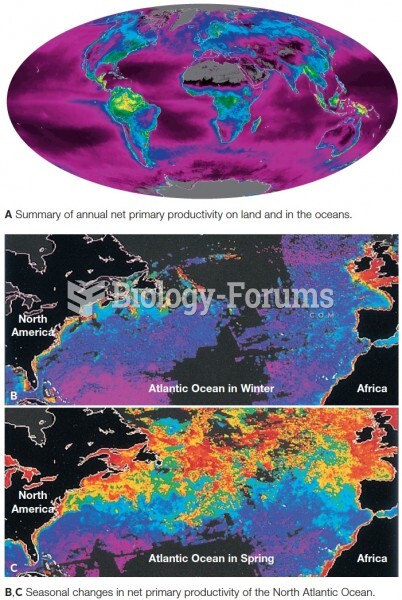 Satellite data showing net primary production. Productivity is coded as red (highest) down through o
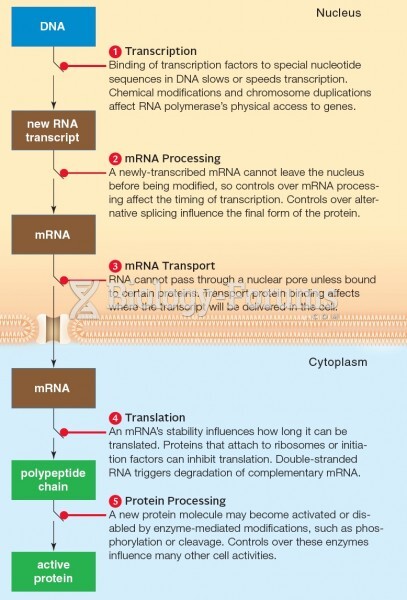 Points of control over eukaryotic gene expression.