|
|
|

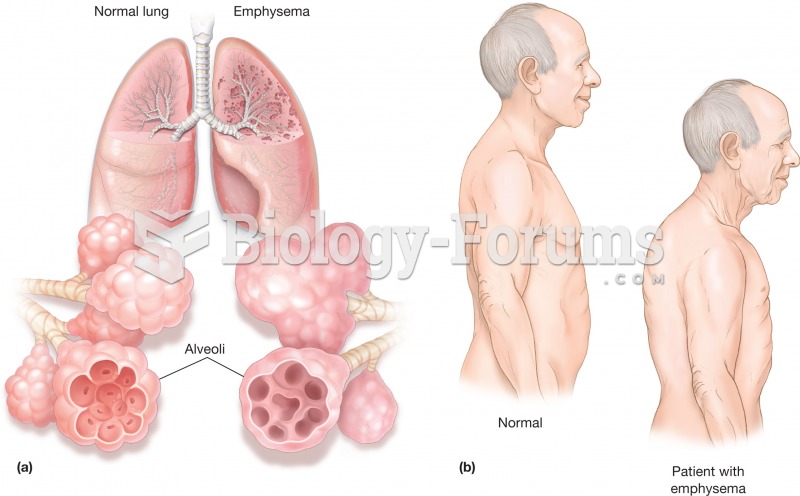 Emphysema. (a) Illustration comparing normal lungs and emphysemic lungs. The inserts illustrate how
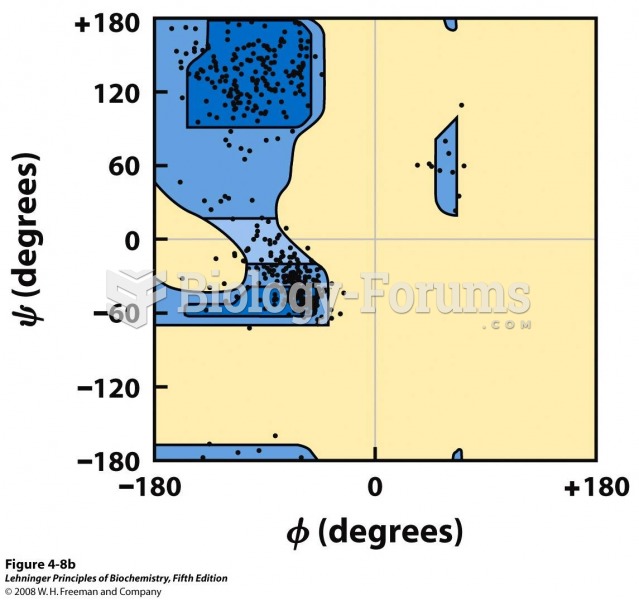 The values of Φ and Ψ for all the amino acid
 How to use a tree diagram to find the probability
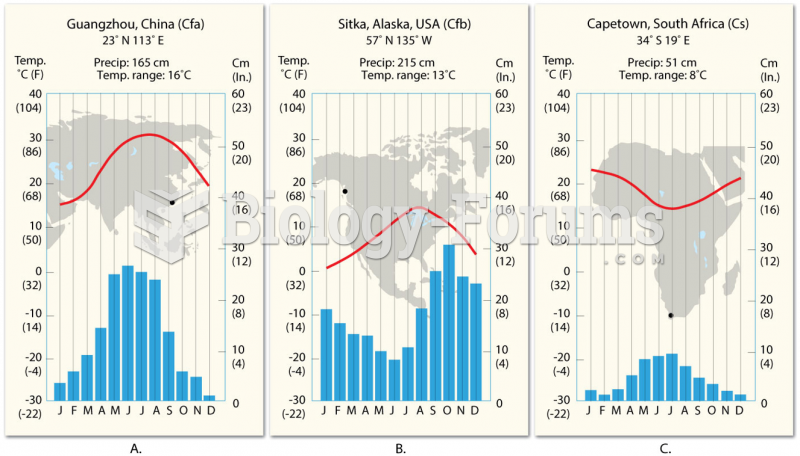 Comparison of C-type Climates
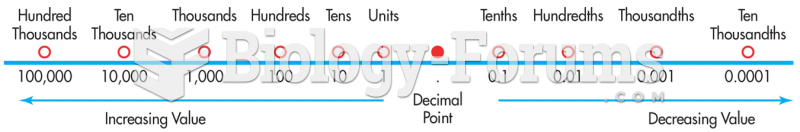 Decimal Values as They Relate to the Location of the Decimal Point
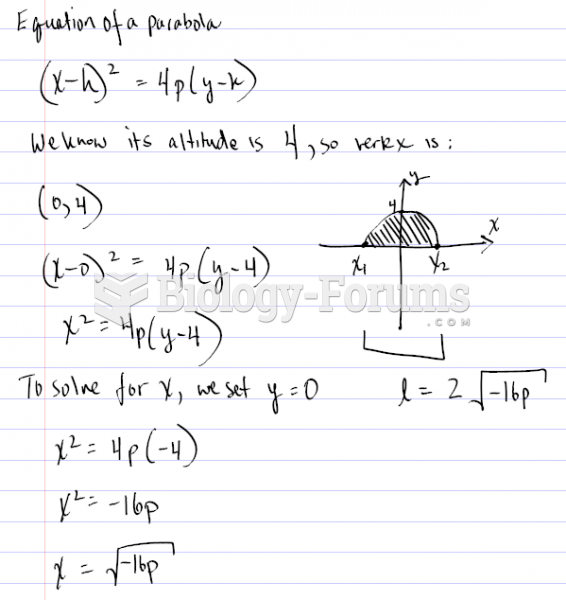 Finding the graph of a Parabola using certain values