This topic contains a solution. Click here to go to the answer
|
|
|

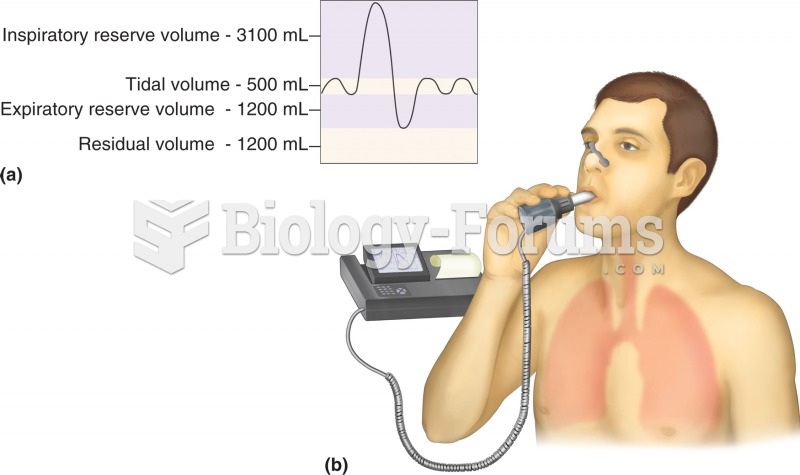 Pulmonary function test: spirometry. (a) Normal respiratory volumes, as measured during spirometry.
 This chart shows the various lines of responsibility and how they differ in presidential and parliam
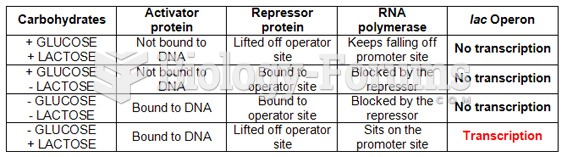 Lactose Operon Summary Chart
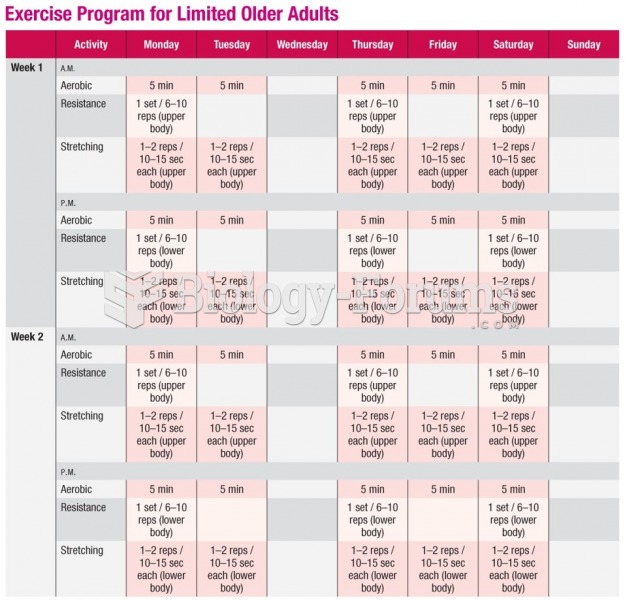 Sample Exercise Program for Limited Older Adults
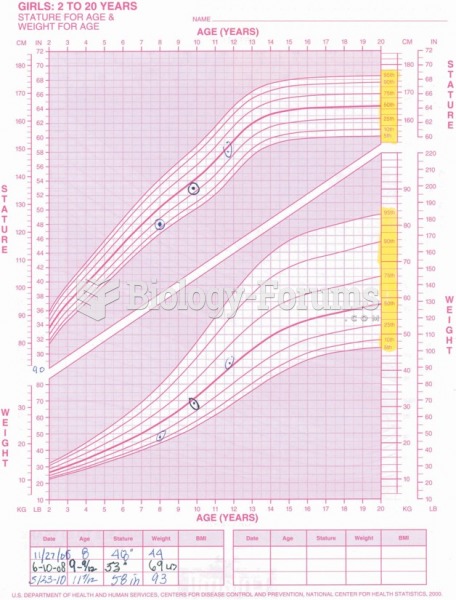 This pediatric growth chart tracks the height and weight for girls ages 2–20.
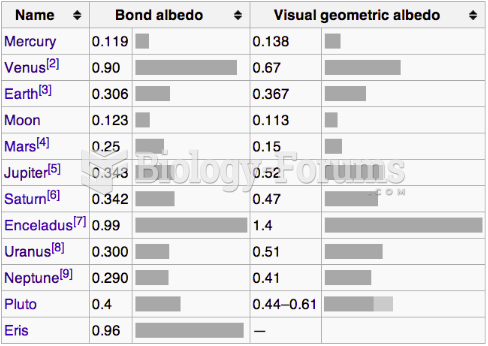 Albedo Chart