This topic contains a solution. Click here to go to the answer
|
|
|

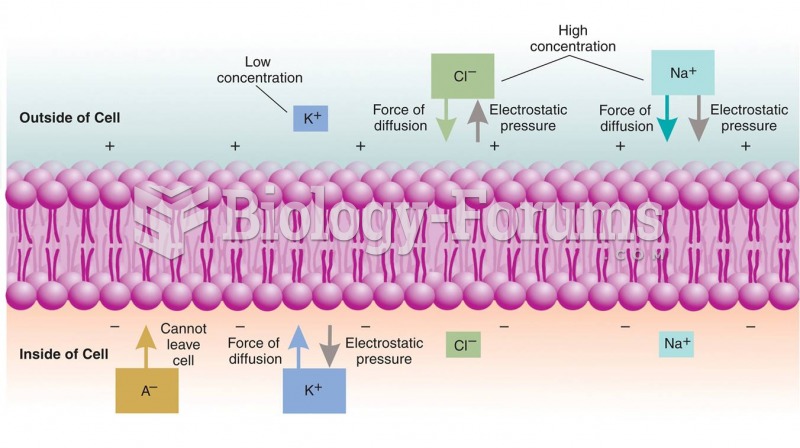 Control of the Membrane Potential
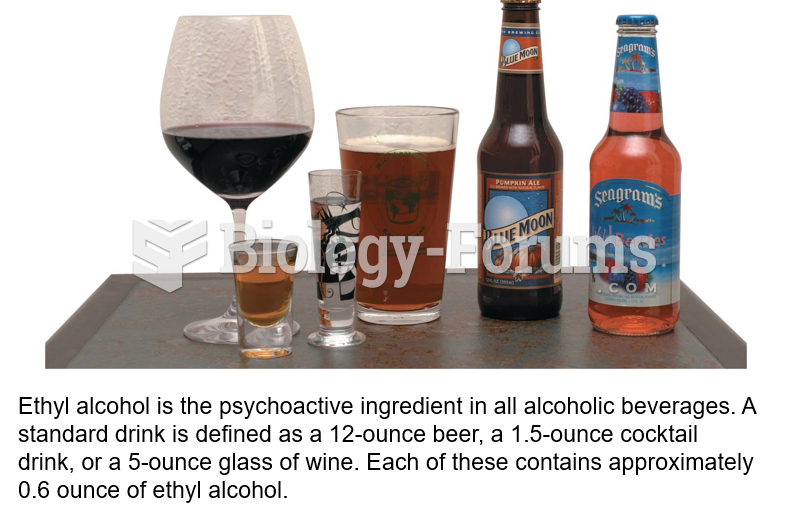 Standard Alcoholic Drink Sizes
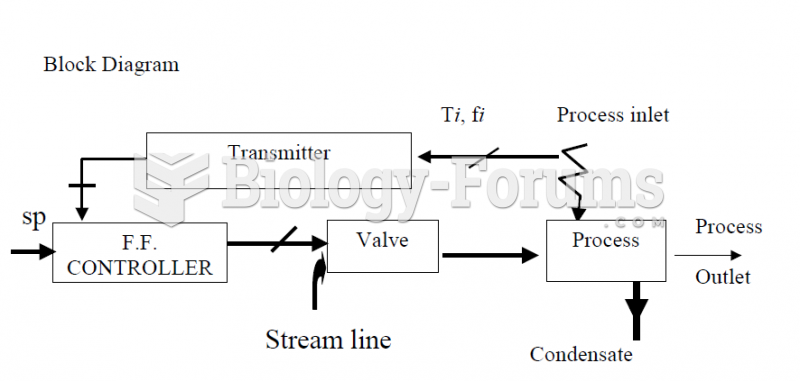 Heat Exchanger Block Diagram Feedforward Control
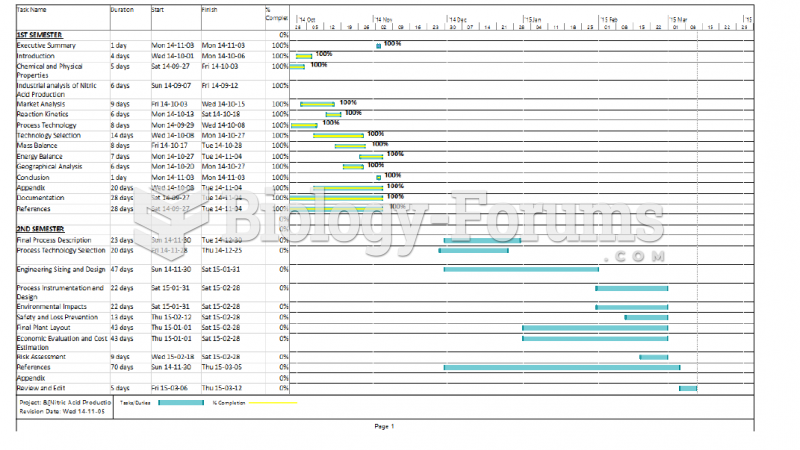 Gantt Chart
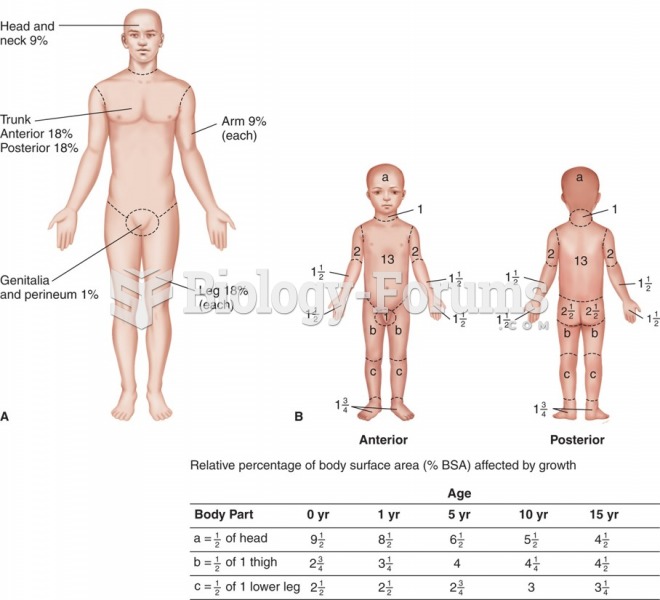 Determining the extent of a burn: (A) rule of nines (adults); (B) Lund-Browder chart (children).
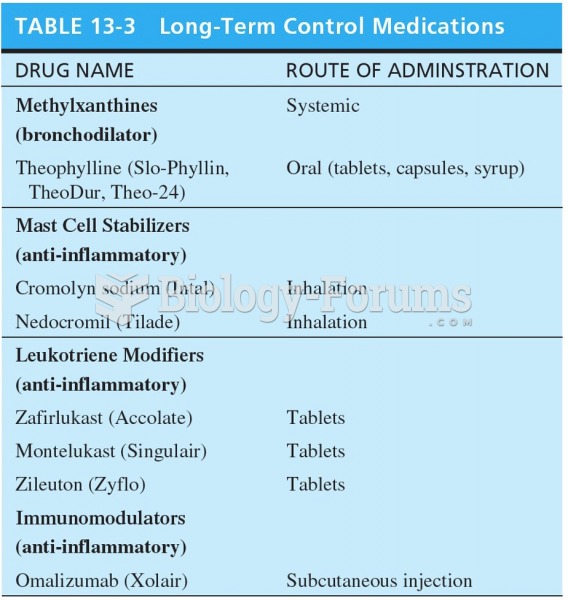 Long Term Control Medications