This topic contains a solution. Click here to go to the answer
|
|
|

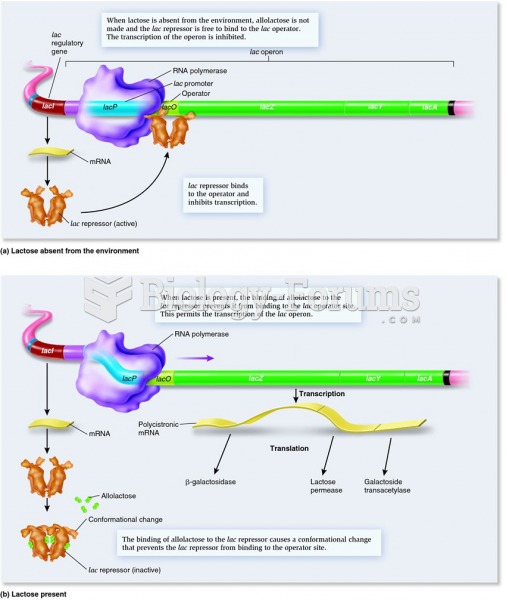 Negative control of an inducible set of genes: function of the lac repressor in regulating the lac o
 This chart illustrates the bottom up assumption about government. In this, attitudes, culture, and
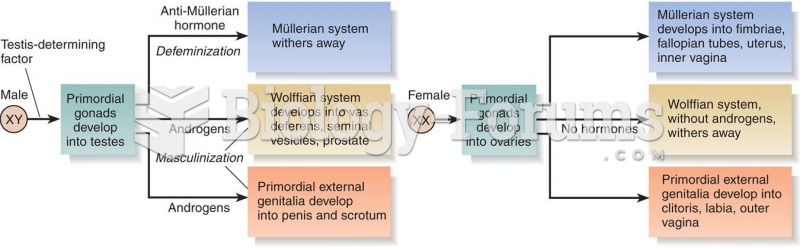 Hormonal Control of Development of the Internal Sex Organs
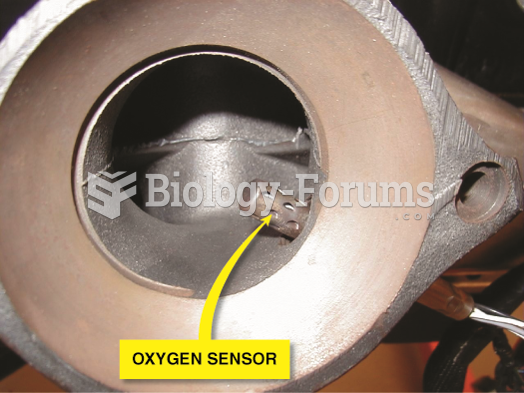 Many fuel-control oxygen sensors are located in the exhaust manifold near its outlet so that the ...
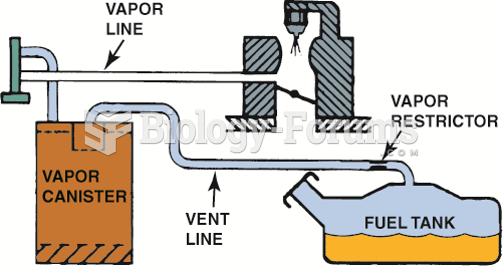 The evaporative emission control system includes all of the lines, hoses, and valves, plus the ...
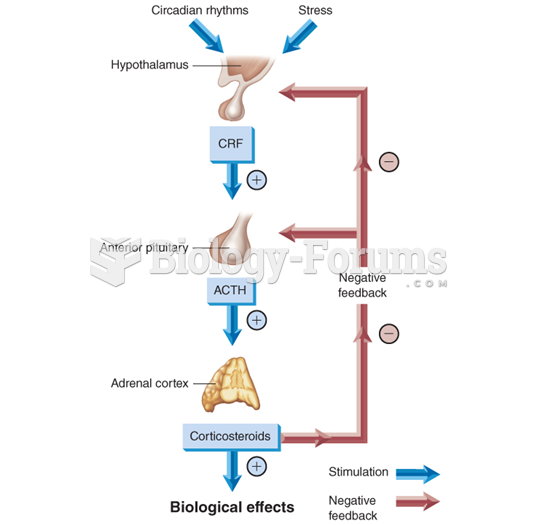 Feedback control of adrenal cortex