|
|
|

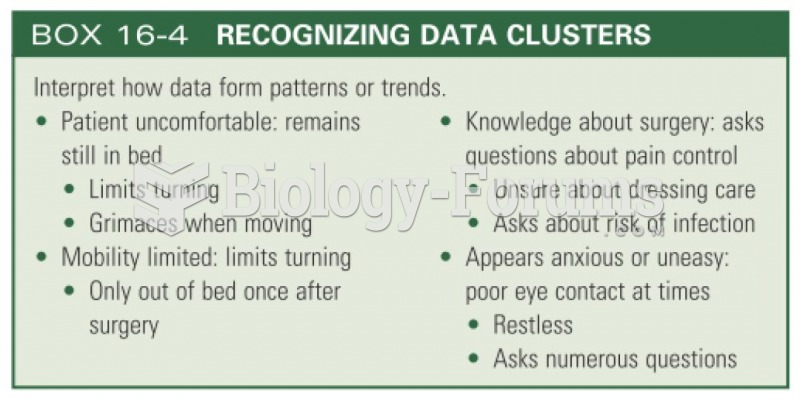 Recognizing data clusters
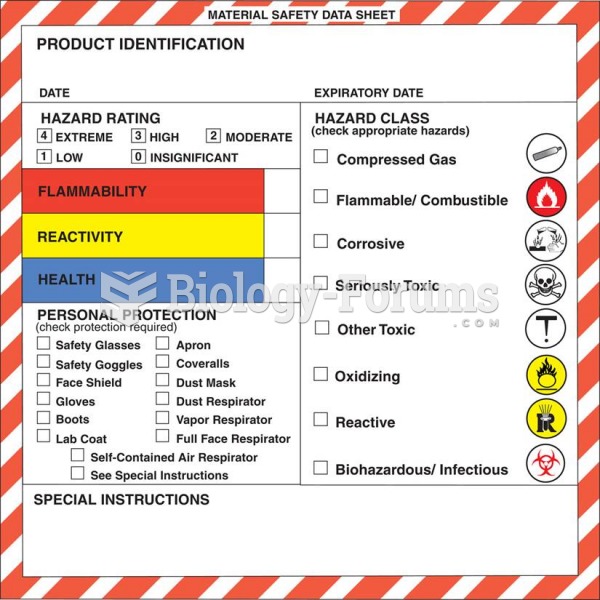 An example of a Material Safety Data Sheet (MSDS).
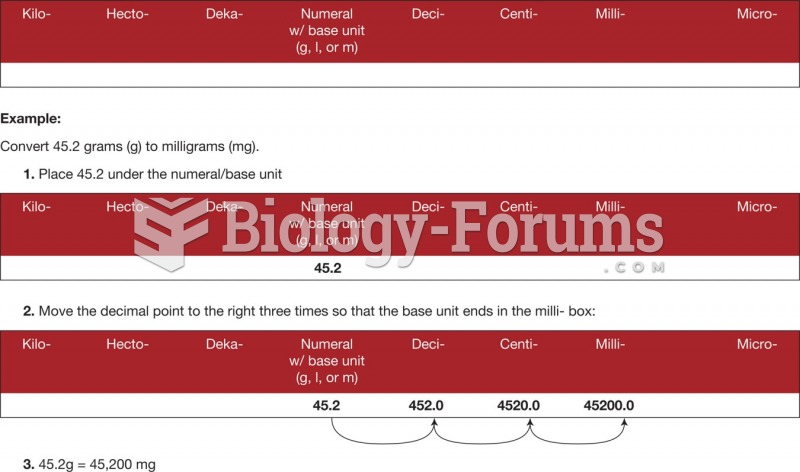 Metric conversion using the place value chart.
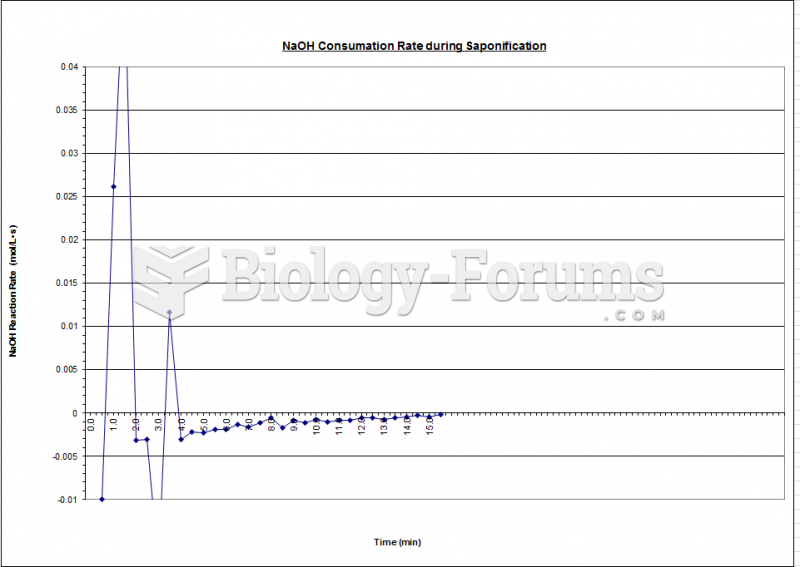 Fluidization - Reaction Rate Chart
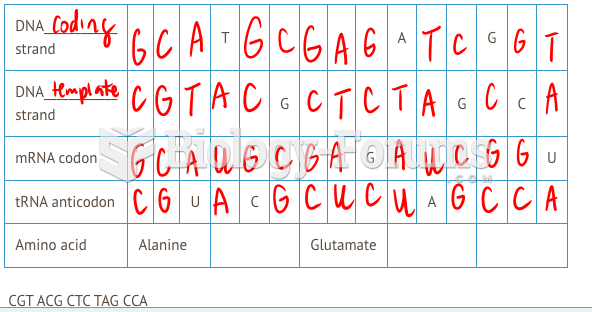 I need help fill up the chart attached phtoto long question
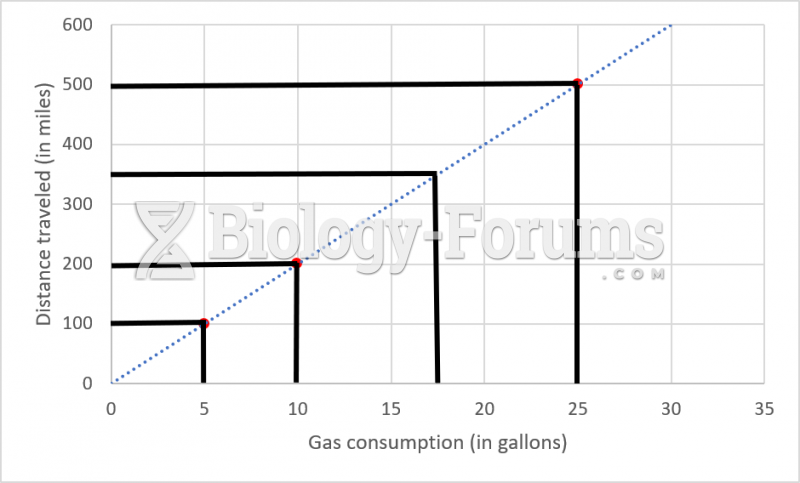 Proportionality chart