The height and weight are recorded by the school nurse for every student in a school. What type of graph would best display the relationship between height and weight?
a. bar graph
b. stem-and-leaf plot
c. histogram
d. scatter diagram
Question 2
A random sample of 121 bottles of cologne showed an average content of 4 ounces. It is known that the standard deviation of the contents (i.e., of the population) is 0.22 ounces. The point estimate of the mean content of the bottles is
a. 0.22
b. 4
c. 121
d. 0.02

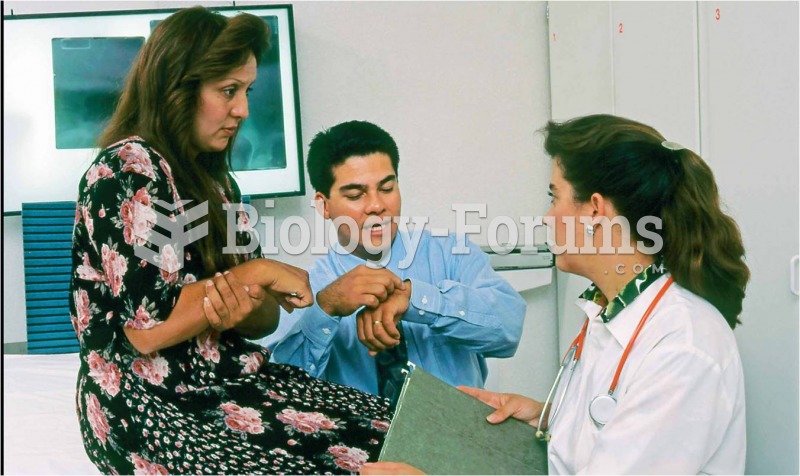 A nurse communicates with her non–English-speaking patient through an interpreter
 Magnet hospital nurse requirements
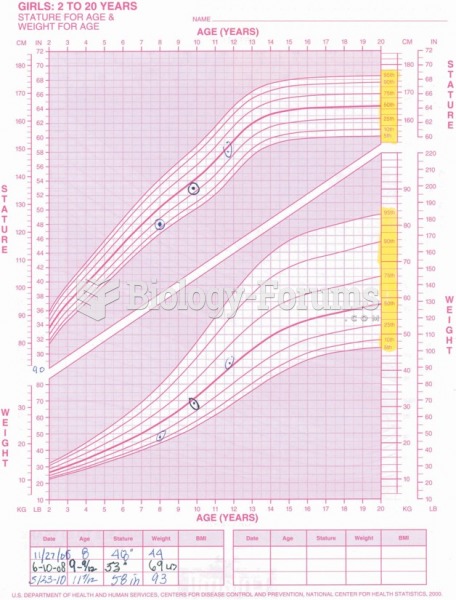 This pediatric growth chart tracks the height and weight for girls ages 2–20.
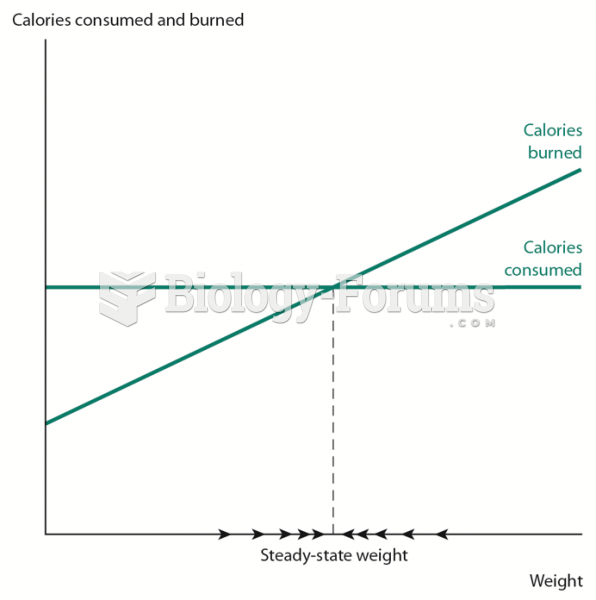 Determination of Steady-State Weight
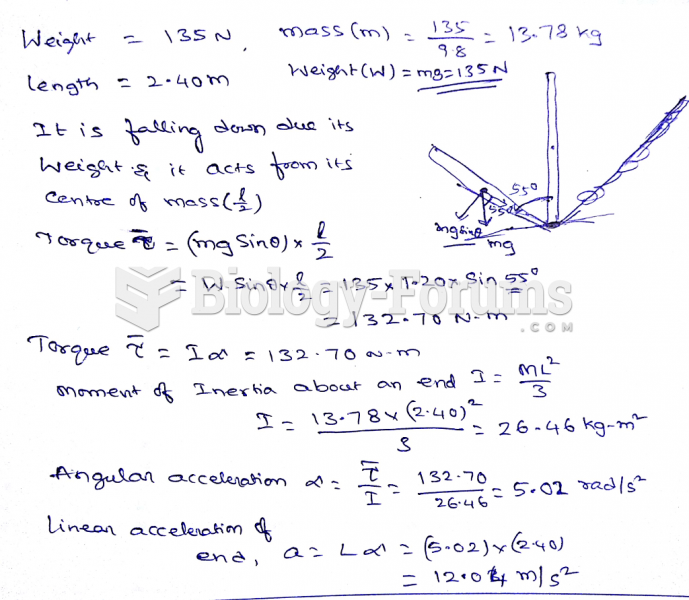 A very thin uniform rod, 2.40 m long and of weight 135 N, has a frictionless hinge at its lower ...
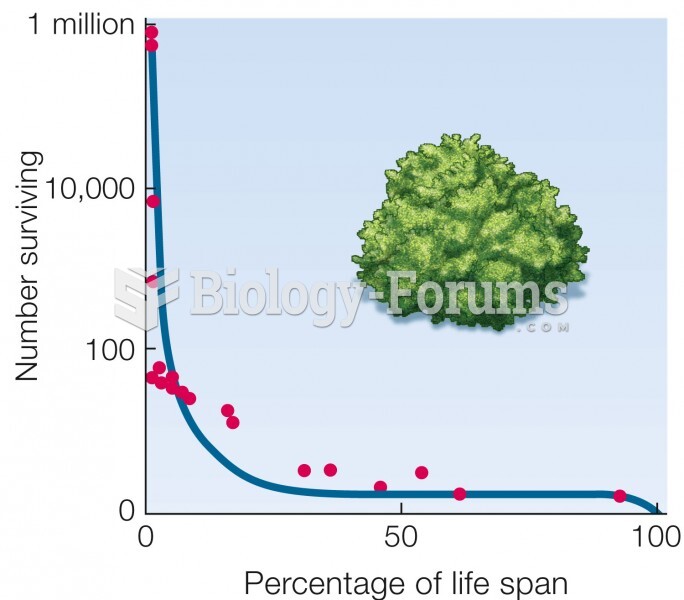 Type III curve. Mortality is highest early in life. Data for a desert shrub (Cleome droserifolia).