The height and weight are recorded by the school nurse for every student in a school. What type of graph would best display the relationship between height and weight?
a. bar graph
b. stem-and-leaf plot
c. histogram
d. scatter diagram
Question 2
A random sample of 121 bottles of cologne showed an average content of 4 ounces. It is known that the standard deviation of the contents (i.e., of the population) is 0.22 ounces. The point estimate of the mean content of the bottles is
a. 0.22
b. 4
c. 121
d. 0.02

 The nurse assesses the patient's ability to use the walker correctly
 C, A nurse can also administer the medication by setting the dose and rate with an electronic infusi
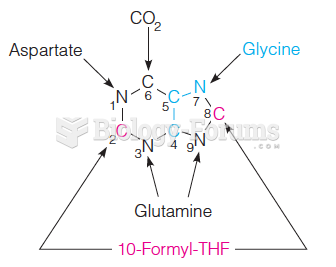 Low-molecular-weight precursors to the purine ring
 Student opening present
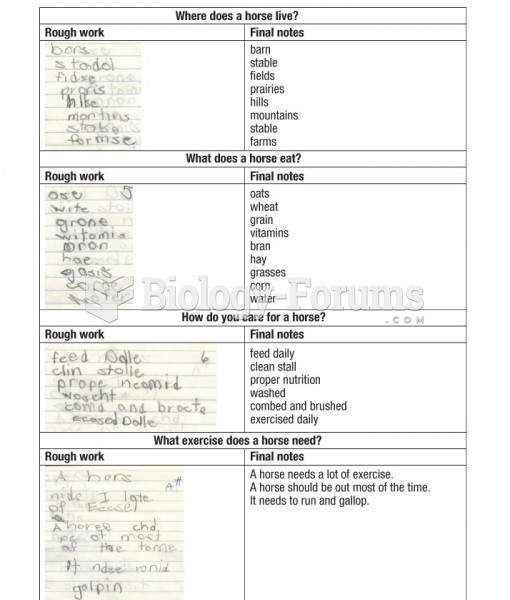 A sample of work by a Grade 4 student with a specific learning disorder
 Family interactive style predicts academic achievement in high school