The height and weight are recorded by the school nurse for every student in a school. What type of graph would best display the relationship between height and weight?
a. bar graph
b. stem-and-leaf plot
c. histogram
d. scatter diagram
Question 2
A random sample of 121 bottles of cologne showed an average content of 4 ounces. It is known that the standard deviation of the contents (i.e., of the population) is 0.22 ounces. The point estimate of the mean content of the bottles is
a. 0.22
b. 4
c. 121
d. 0.02

 Nurse-patient interaction; nonverbal communication
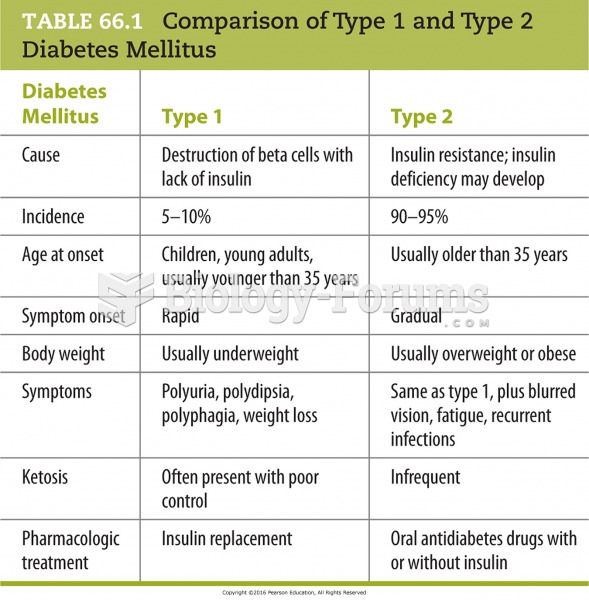 Comparison of Type 1 and Type 2 Diabetes Mellitus
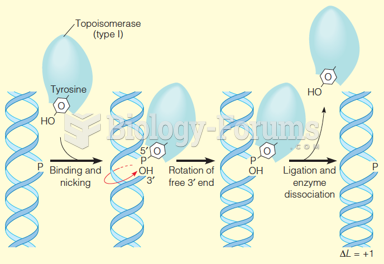 Action of a type I topoisomerase
 School can be discouraging and frustrating place for a child with a learning disability
 Student opening present
 QTL Analysis of Tomato Weight in Backcross Progeny