A graphical method that can be used to show both the rank order and shape of a data set simultaneously is a _____.
a. relative frequency distribution
b. pie chart
c. stem-and-leaf display
d. pivot table
Question 2
Random samples of size 17 are taken from a population that has 200 elements, a mean of 36, and a standard deviation of 8 . Which of the following best describes the form of the sampling distribution of the sample mean for this situation?
a. Approximately normal because the sample size is small relative to the population size
b. Approximately normal because of the central limit theorem
c. Exactly normal
d. None of these alternatives is correct.

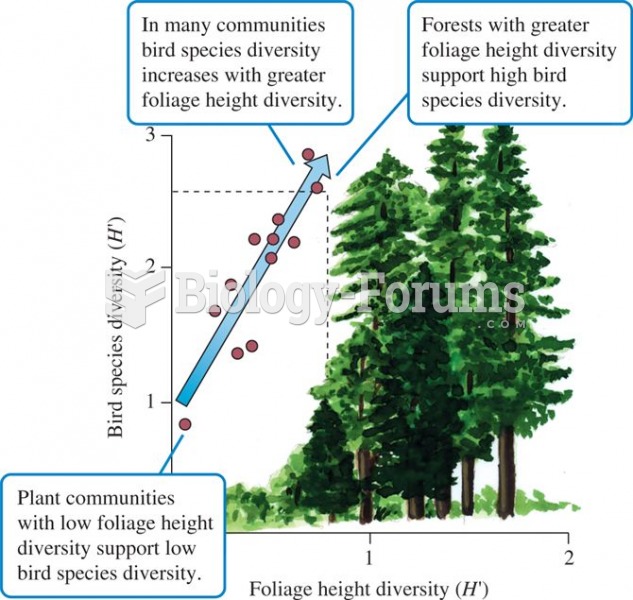 Foliage height diversity and bird species diversity (data from MacArthur and MacArthur 1961).
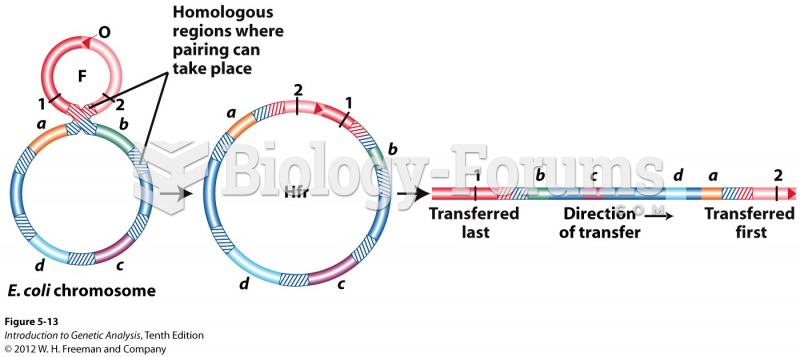 A single crossover inserts F at a specific locus, which then determines the order of gene transfer
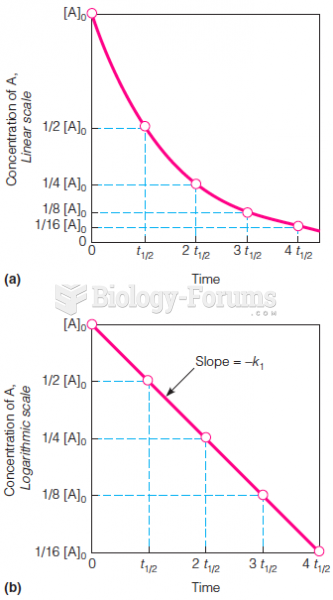 Determining the order and rate constant of an irreversible first-order reaction
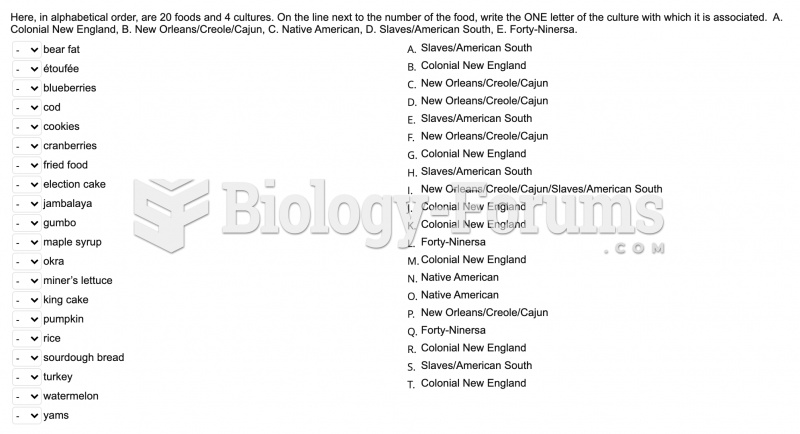 Here, in alphabetical order, are 20 foods and 4 cultures.
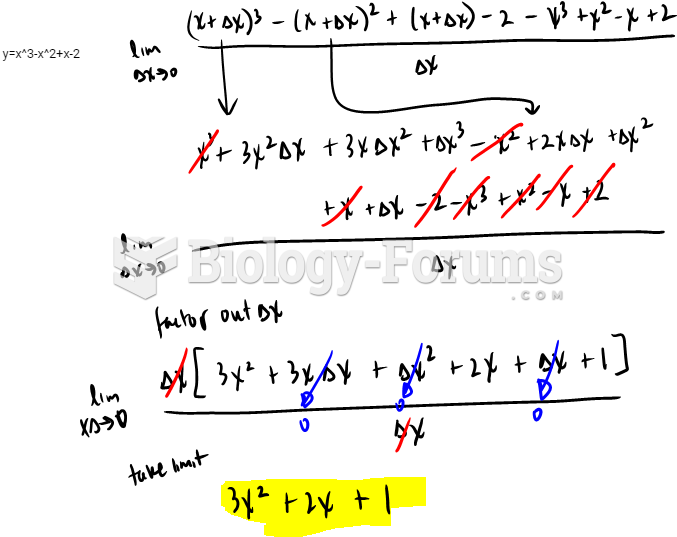 How do solve the derivative of y=x^3-x^2+x-2 using delta method.
 The Hfr chromosome time-of-entry map is assembled from the recombinant data