|
|
|

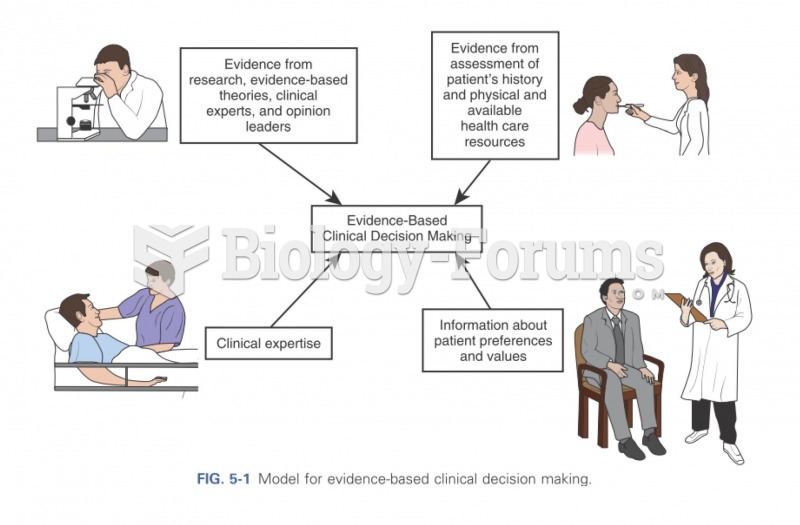 Model for evidence-based clinical decision making.
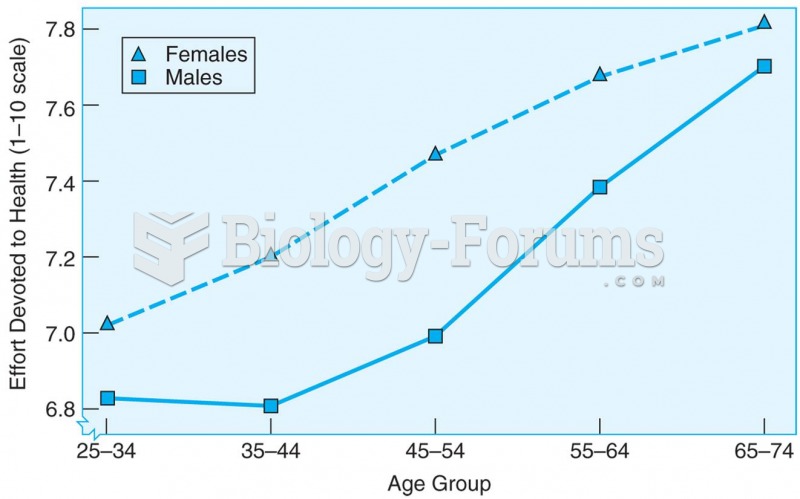 Cross-sectional data showing that the amount of effort spent on personal health care increases with
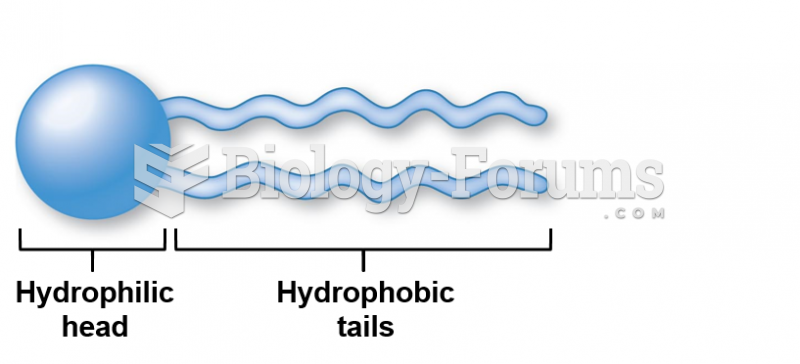 Schematic representation of phospholipid molecule
 Performing Transmission-Based Precaution: Isolation Techniques
 How to plot a sine function containing an amplitude and phase-shift (Question 2 of 3)
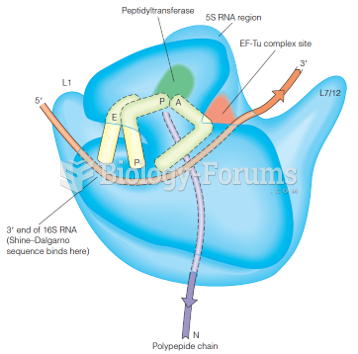 A model of the 70S ribosome based upon early structural data