|
|
|

 Graphical Multipolar Neuron
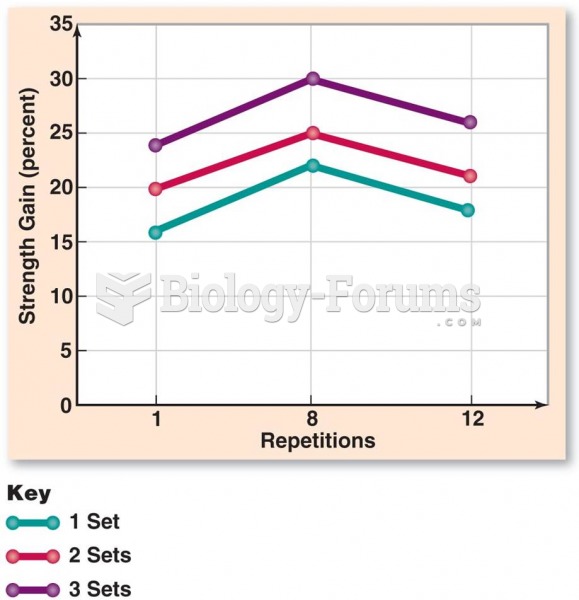 Strength Gains: Based on Sets and Repetitions
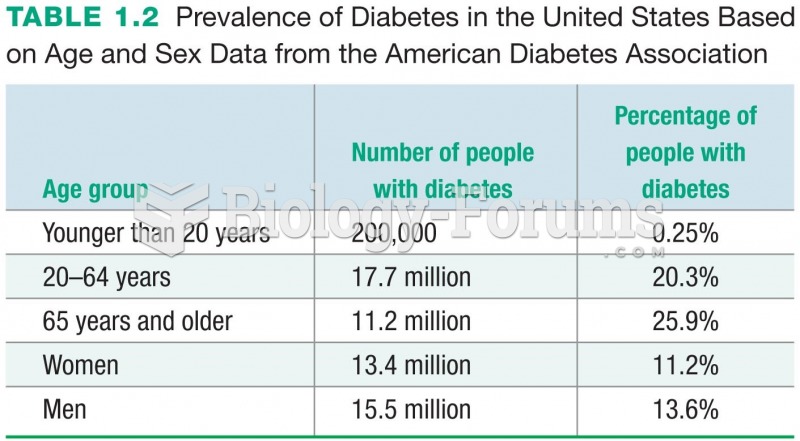 Prevalence of Diabetes in the United States Based on Age and Sex Data from the American Diabetes ...
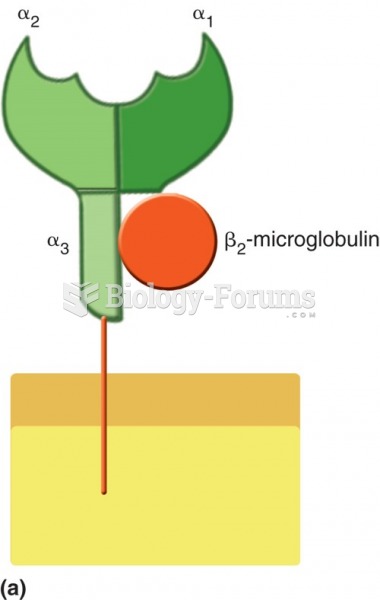 Schematic representation of MHC class I molecule, consisting of 3 α domains and 1 β2-microglobulin ...
 How to plot a sine function containing an amplitude and phase shift (Question 1 of 3)
 How to find the quartiles and percentiles for a data set