|
|
|

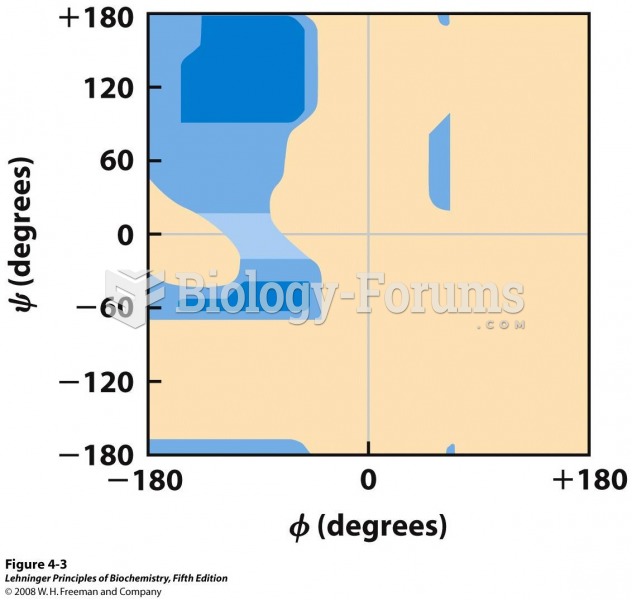 Ramachandran plot for L-Ala residues
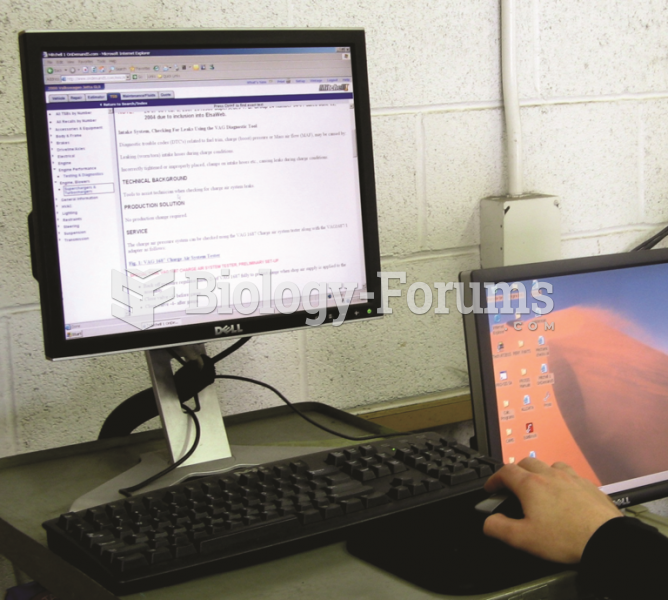 Electronic service information is available from aftermarket sources, such as All-Data and ...
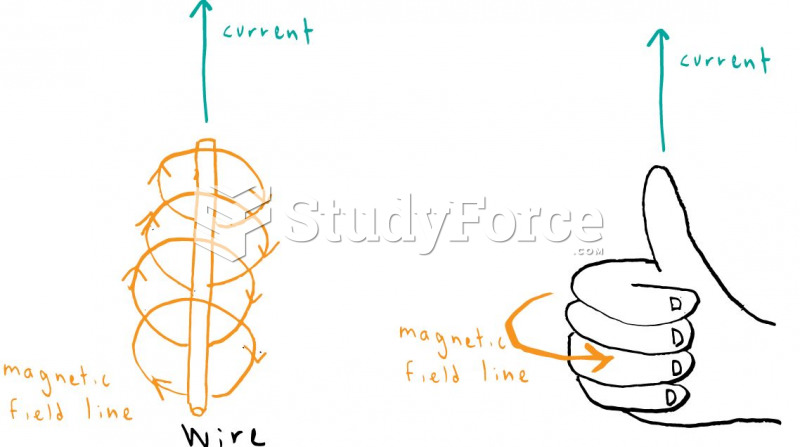 Right-hand Rule
 Foundations of evidence-based practice.
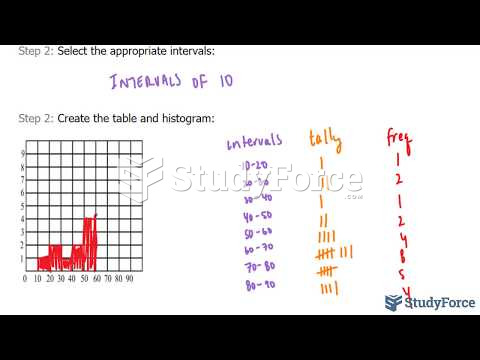 How to create a frequency table and histogram from raw data
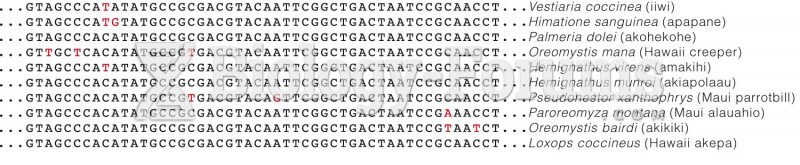 Cladogram Based On DNA Sequence