This topic contains a solution. Click here to go to the answer
|
|
|

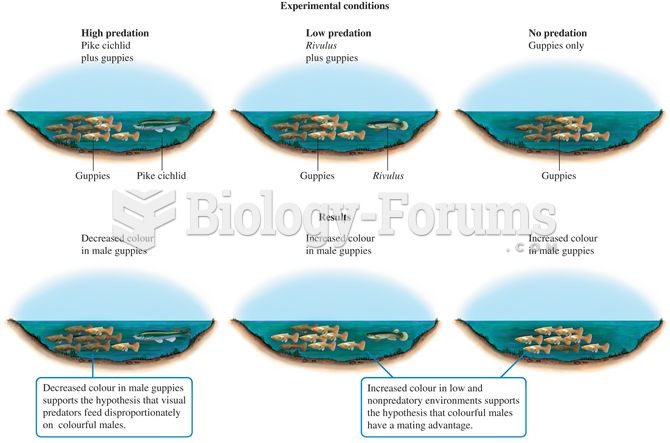 Summary of greenhouse experimental design and results
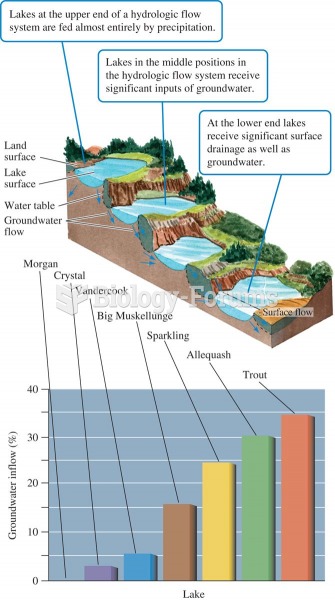 Lake position in the landscape and proportion of water received as groundwater (data from Webster et
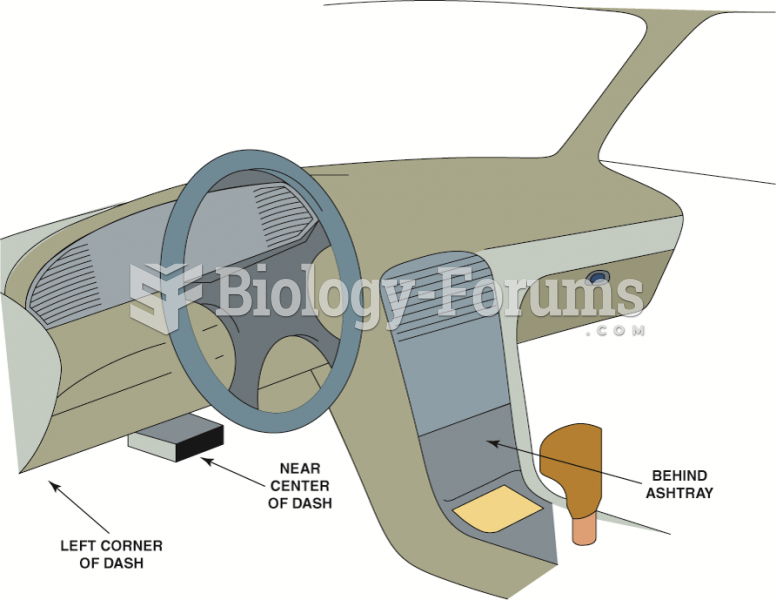 The data link connector (DLC) can be located in various locations.
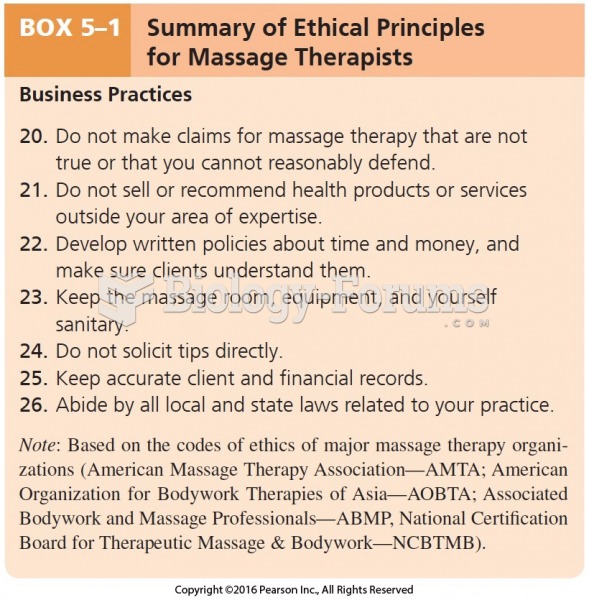 Summary of Ethical Principles for Massage Therapists Cont.
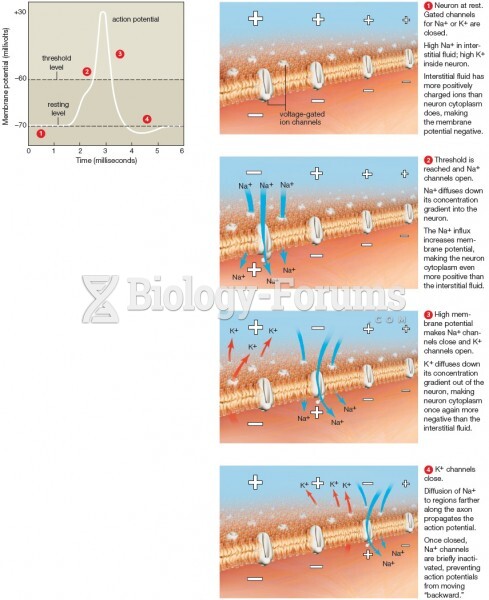 Action Potential Summary
 Linkage Data from 39 Families with Cystic Fibrosis