|
|
|

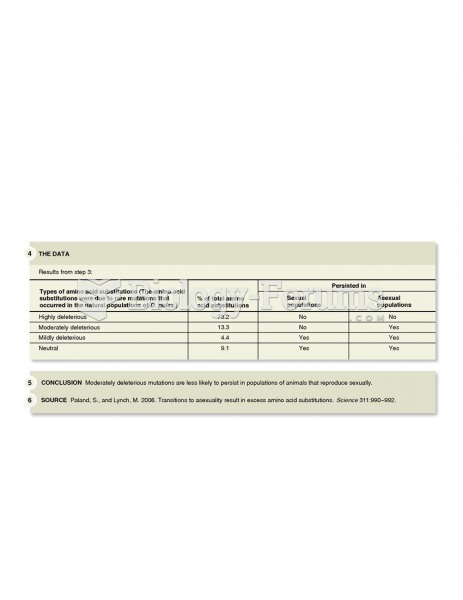 Paland and Lynch demonstrated the importance of sexual reproduction in reducing the frequency of mal
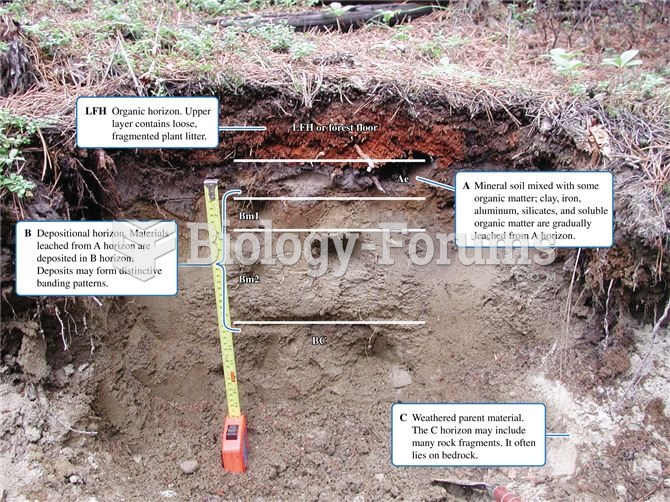 Soil profile exposed in a boreal forest site, showing LFH, A, B, and C horizons.
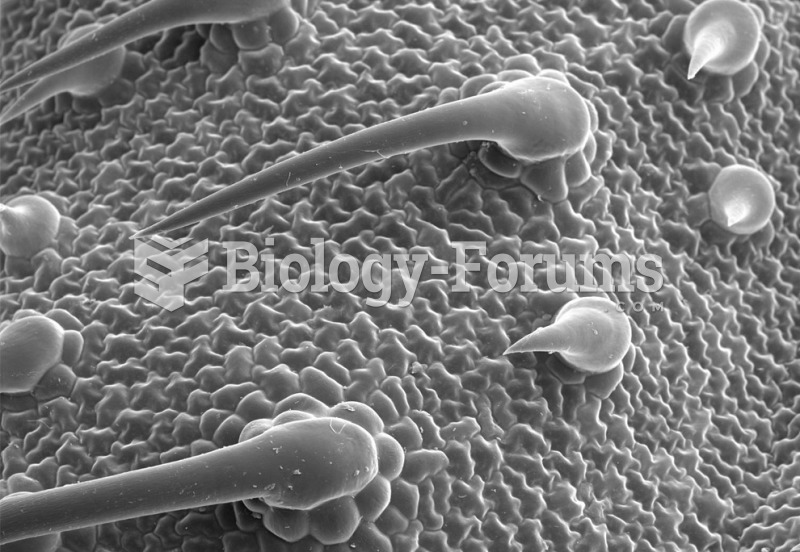 Heliotropium (marine heliotrope) lower leaf surface, showing trichomes and a few stomata
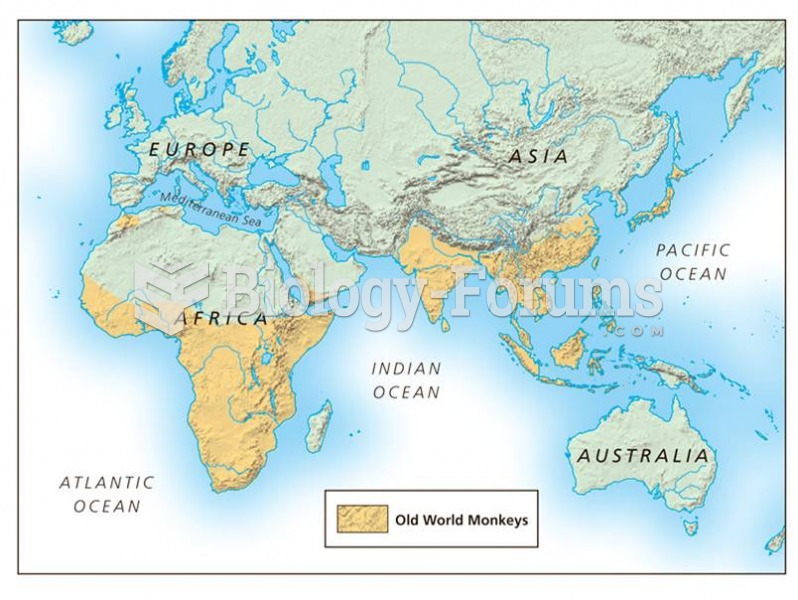 Distribution of the Old World monkeys.
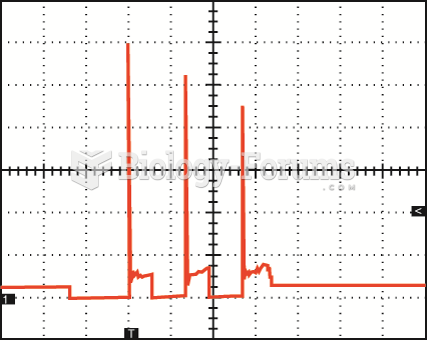 A secondary waveform of a Ford 4.6 liter V-8, showing three sparks occurring at idle speed.
 Data Used to Analyze Productivity in Country 1 and Country 2