This topic contains a solution. Click here to go to the answer
|
|
|

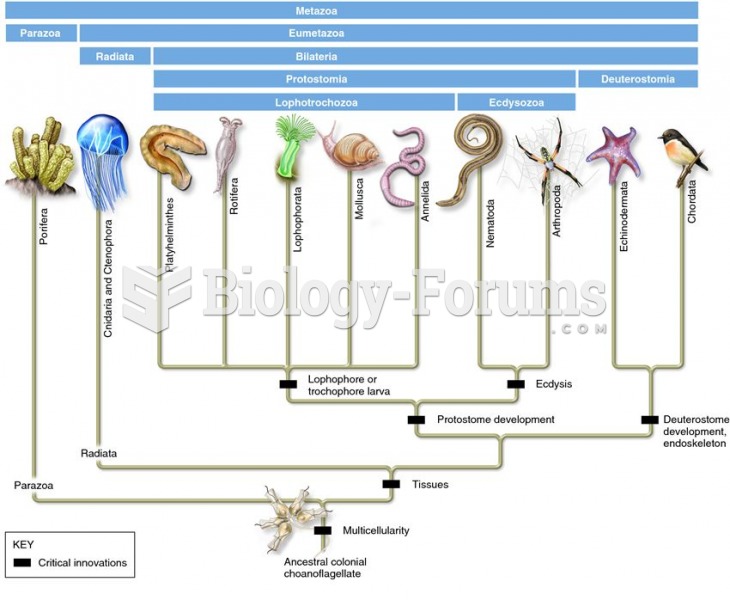 A revised animal phylogeny based on molecular data of SSU rRNA
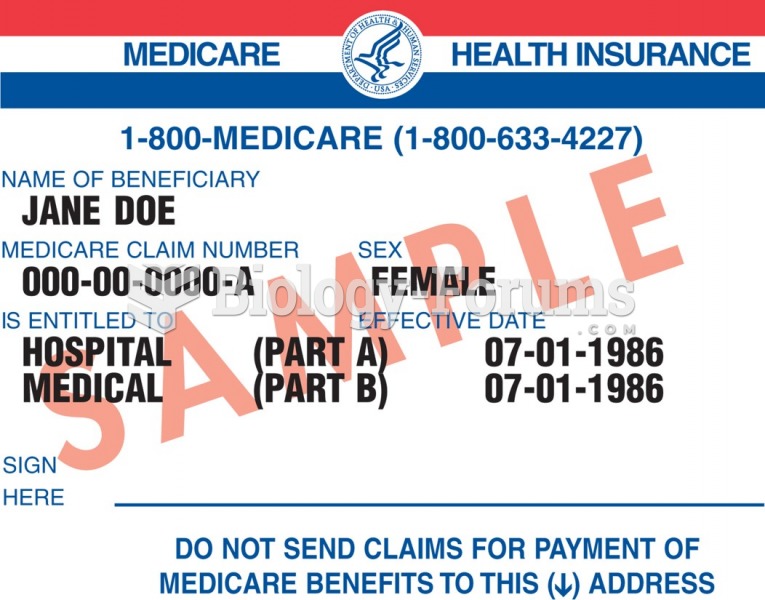 Sample Medicare identification card.
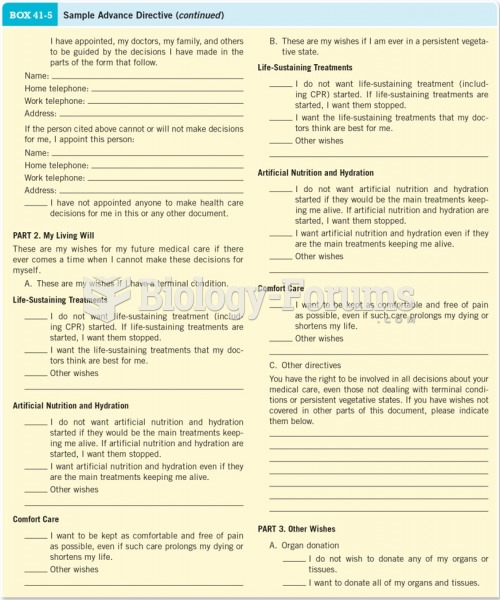 Sample Advance Directive Cont.
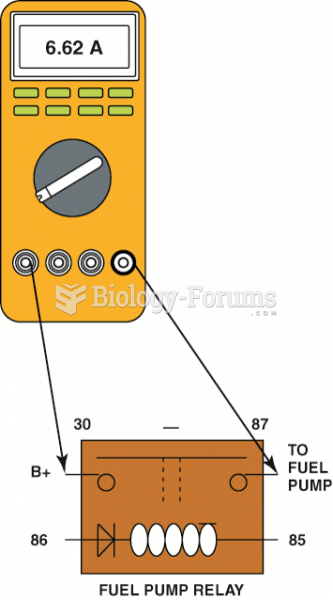 Hookup for testing fuel-pump current draw on any vehicle equipped with a fuel-pump relay.
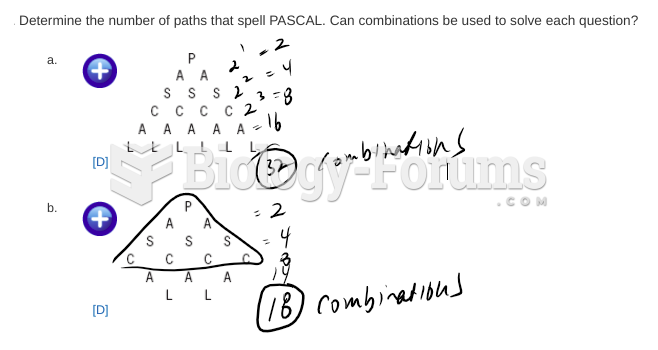 Data management questions
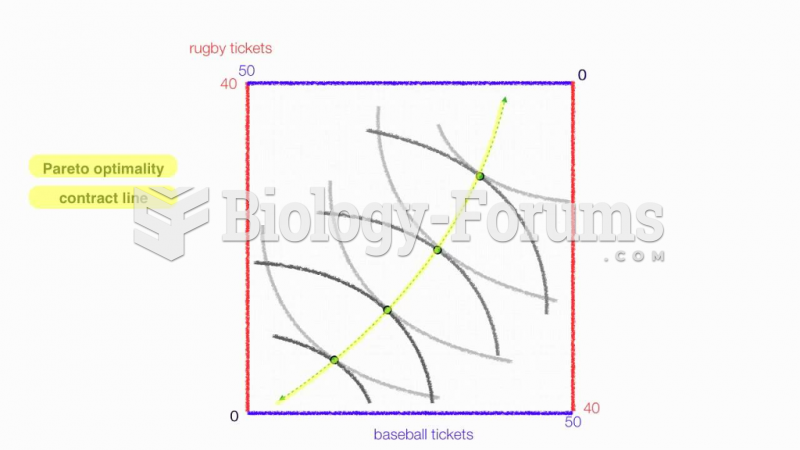 Draw an Edgeworth box for two consumers over two goods