This topic contains a solution. Click here to go to the answer
|
|
|

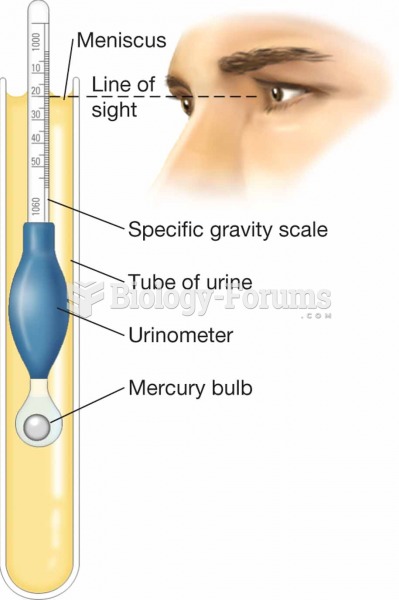 Urinometer. In this procedure, a urine sample and urinometer are placed within a tube, and the liqui
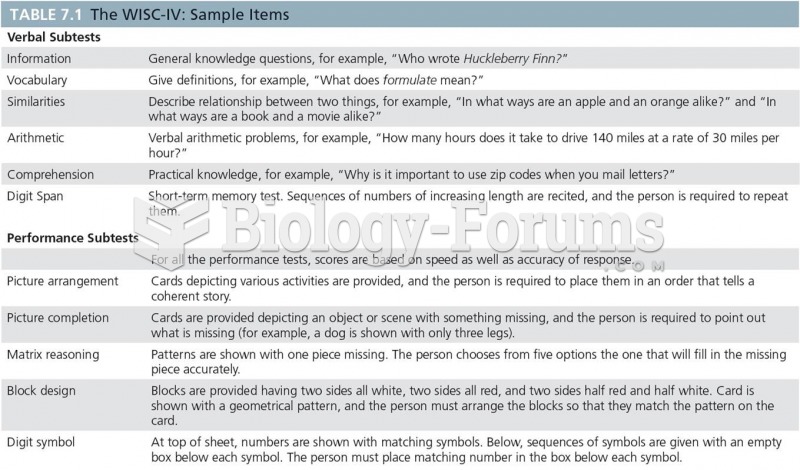 The WISC-IV: Sample Items
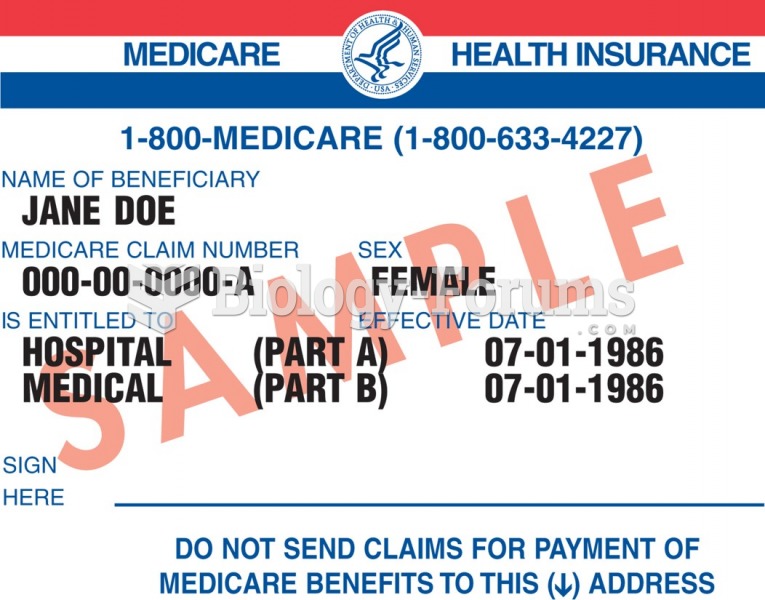 Sample Medicare identification card.
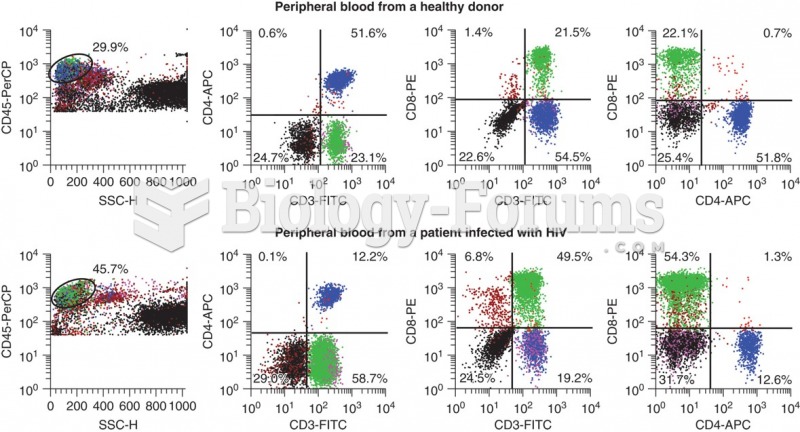 Flow cytometry data that shows the differences in CD3+ CD4+ cells that occur with HIV infection. ...
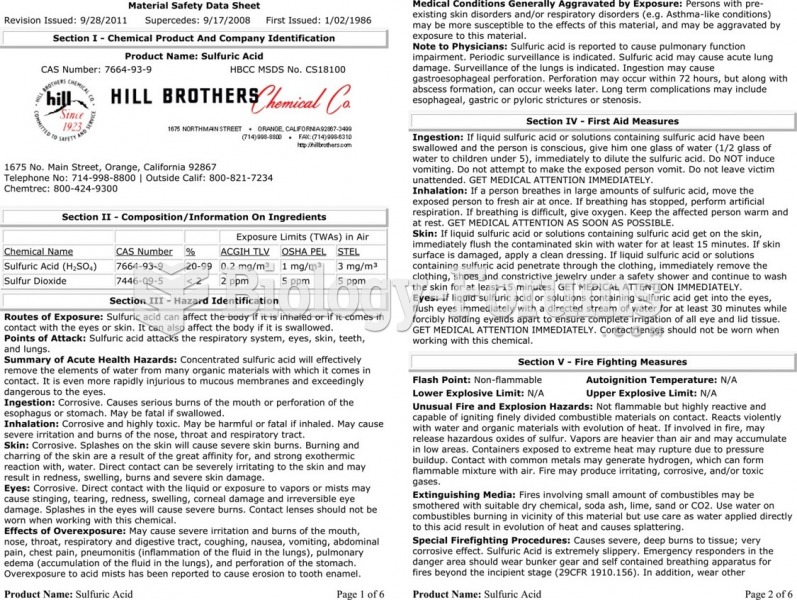 The material safety data sheet (MSDS) for sulfuric acid showing the detailed technical information ...
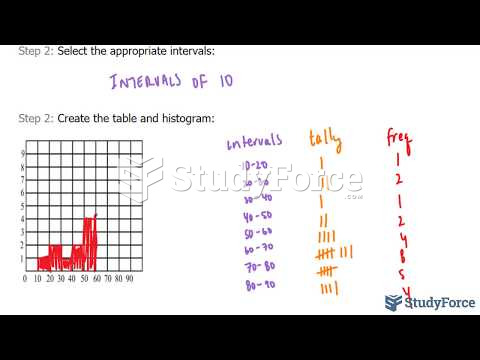 How to create a frequency table and histogram from raw data