This topic contains a solution. Click here to go to the answer
|
|
|

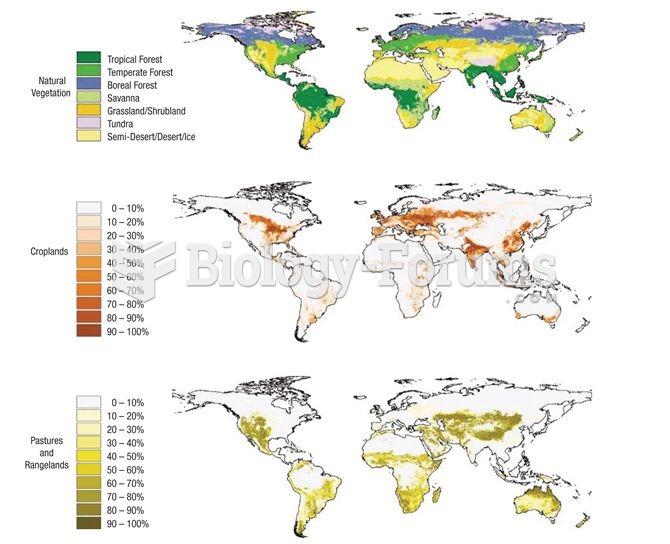 Extent of agricultural activity across the planet (data from Foley et al. 2005).
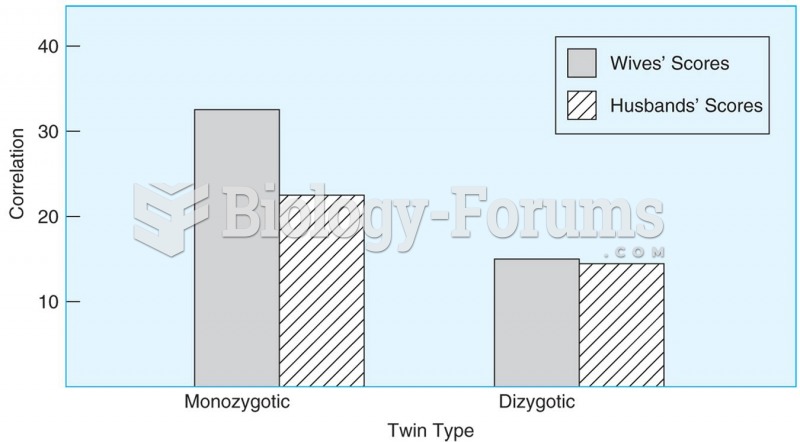 Women who are monozygotic twins and have the same genes are more similar in their marital happiness
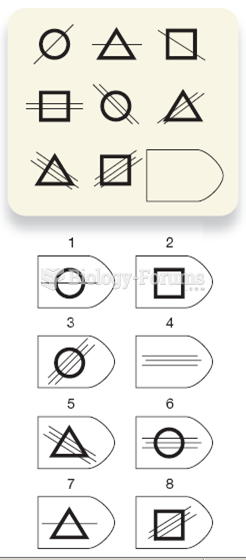 Sample Problem from Raven’s Progressive Matrices
 Electronic service information is available from aftermarket sources, such as All-Data and ...
 A company purchased 26 desks for $240 each and 18 chairs for $59 each. Compute the total ...
 Sample hypnograms of an infant at ages 3, 12, and 24 months