This topic contains a solution. Click here to go to the answer
|
|
|

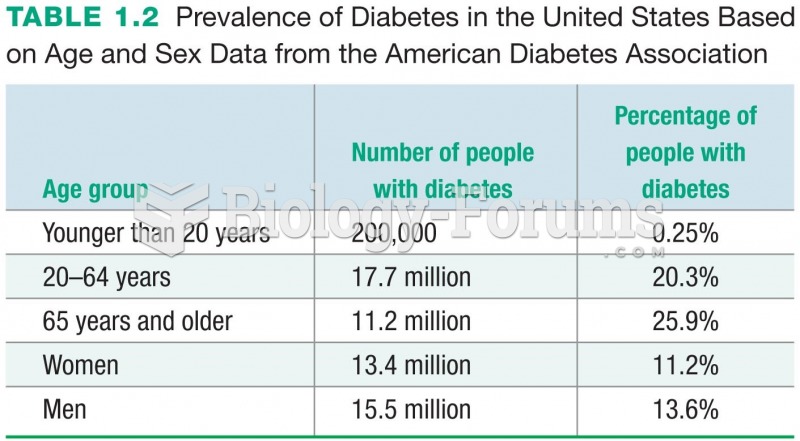 Prevalence of Diabetes in the United States Based on Age and Sex Data from the American Diabetes ...
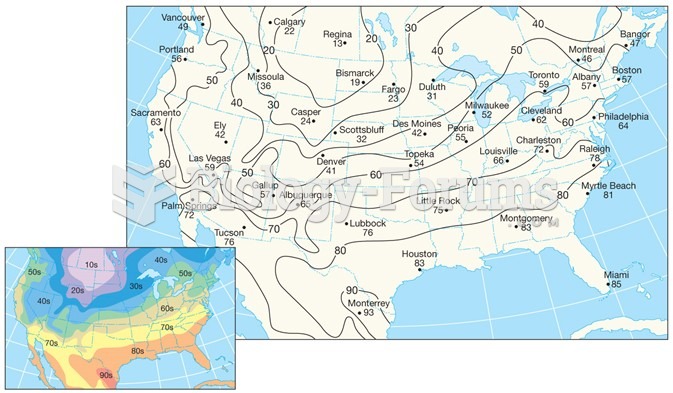 Air-Temperature Data
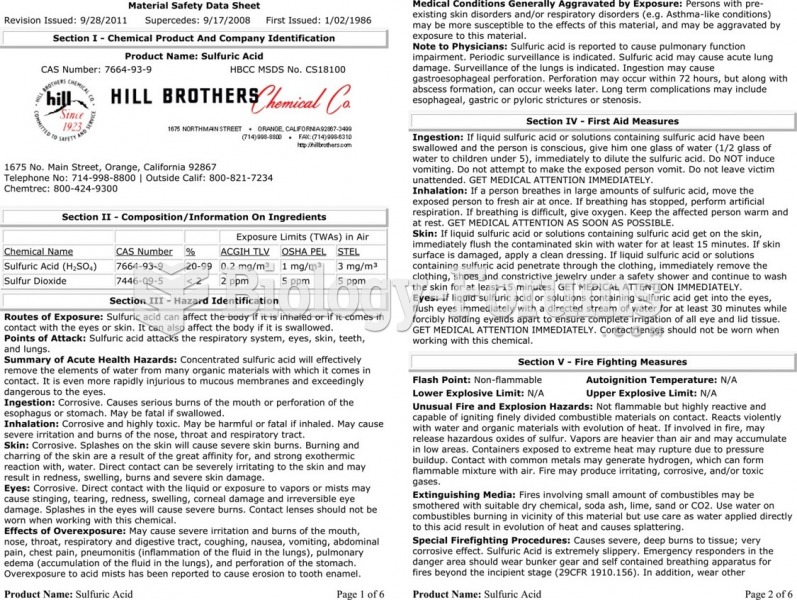 The material safety data sheet (MSDS) for sulfuric acid showing the detailed technical information ...
 Basic Marketing Research: Using Microsoft Excel Data Analysis
![What is the [OH-] in a seawater sample if the pH is 8.65?](https://biology-forums.com/gallery/43/medium_6_11_01_22_1_38_03.png) What is the [OH-] in a seawater sample if the pH is 8.65?
What is the [OH-] in a seawater sample if the pH is 8.65?
 Sturtevant’s Recombination Data for Five X-Linked Genes in Drosophila