This topic contains a solution. Click here to go to the answer
|
|
|

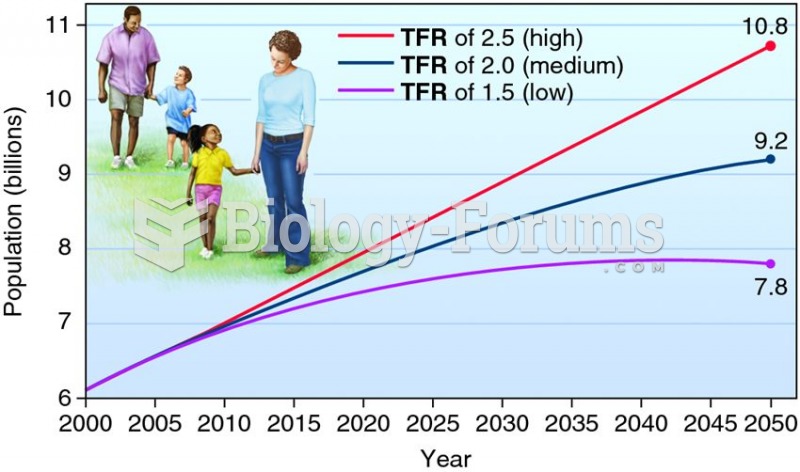 Population predictions for 2000–2050, using three different total fertility rates (
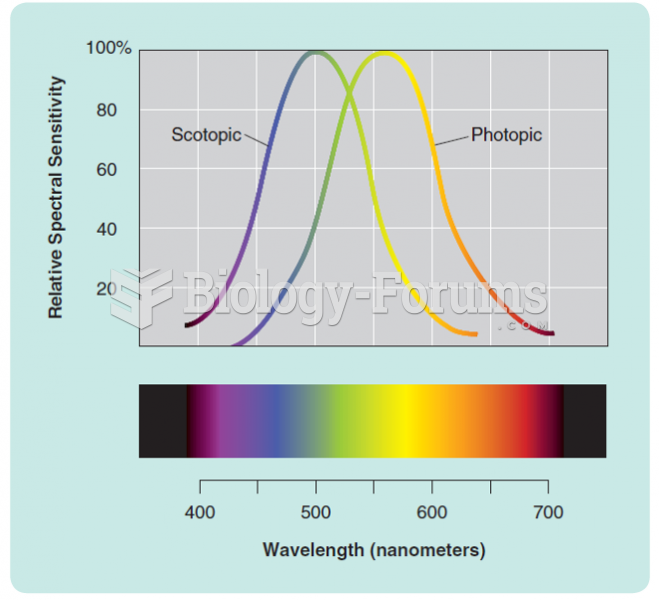 Human photopic (cone) and scotopic (rod) spectral sensitivity curves. The peak of each curve has ...
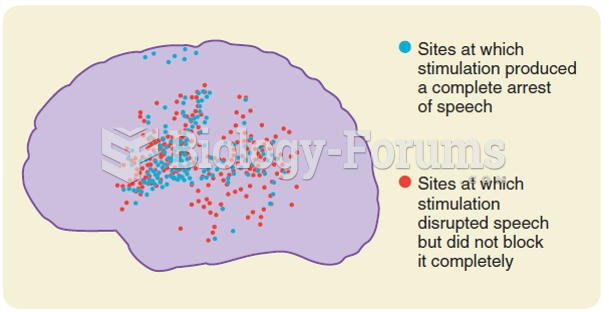 The wide distribution of left hemisphere sites where cortical stimulation either blocked speech or ...
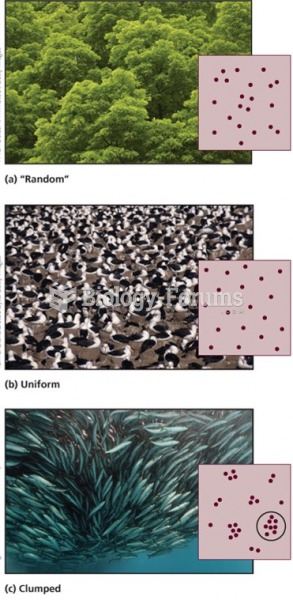 Population distribution (dispersion)
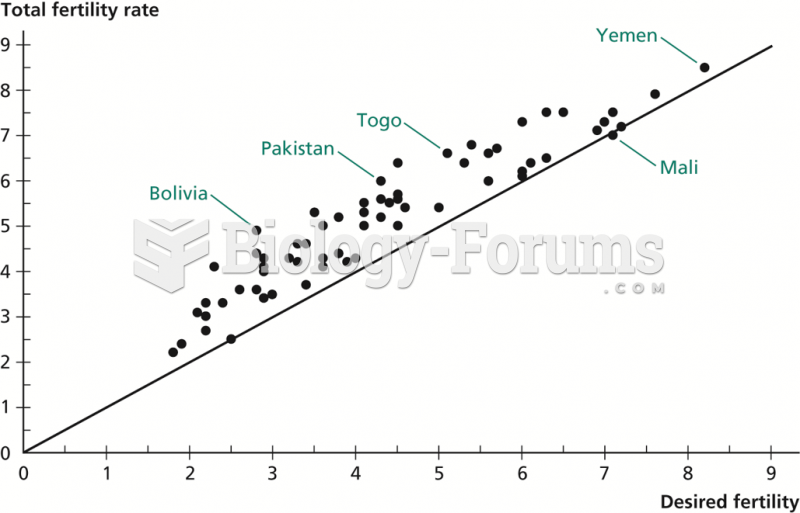 Desired Fertility versus Total Fertility Rate in Developing Countries
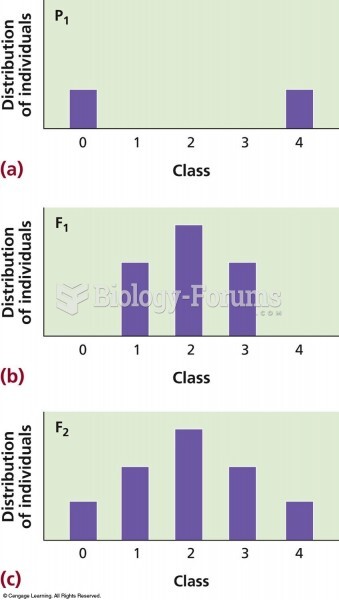 Frequency diagrams of skin colors. (a) Skin color distribution in the parents falls into two discont