This topic contains a solution. Click here to go to the answer
|
|
|

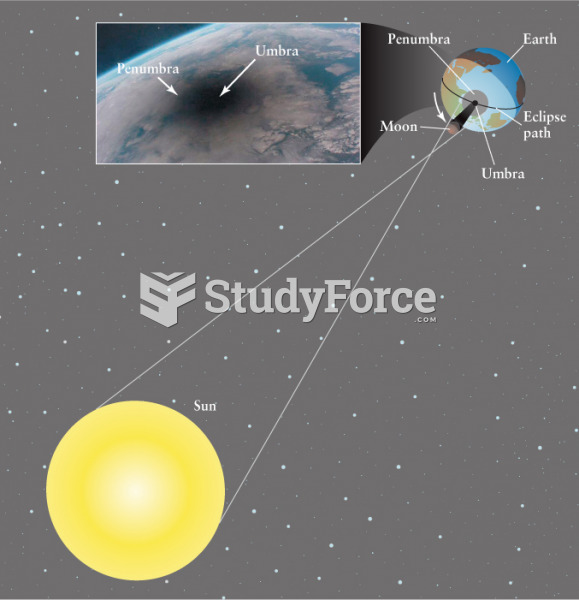 The Geometry of a Total Solar Eclipse
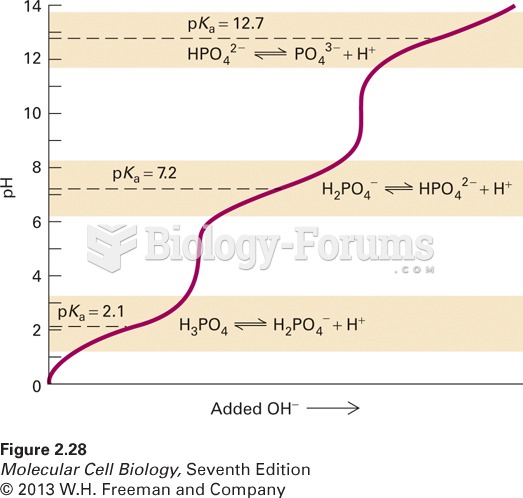 The titration curve of phosphoric acid (H3PO4), a common buffer in biological sy
 How to plot a sine function containing an amplitude and phase shift (Question 1 of 3)
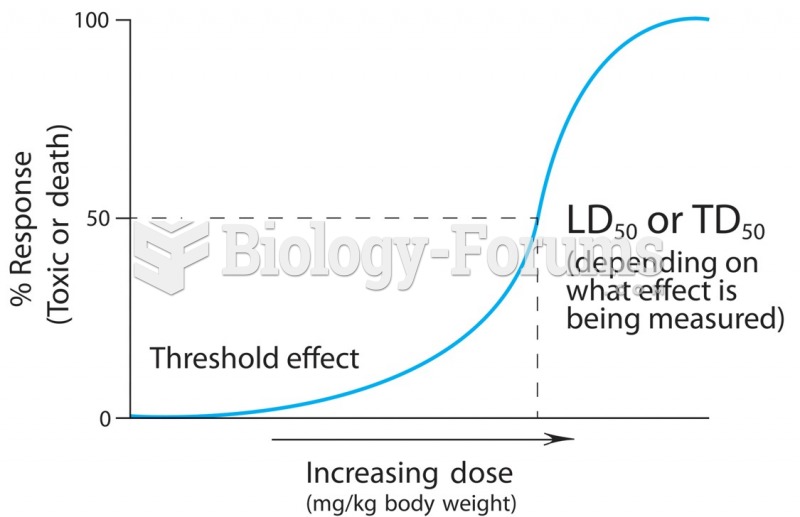 A dose-response curve describes the relationship between the quantity of the chemical entering the ...
 Discrete random variables- Probability Distribution Function
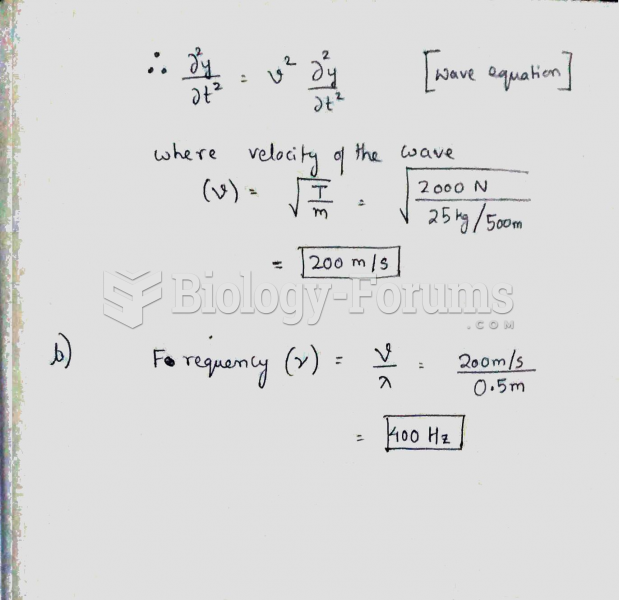 A wave whose wavelength is 0.500 m is traveling down a 500-m long wire whose total mass is 25 ...