This topic contains a solution. Click here to go to the answer
|
|
|

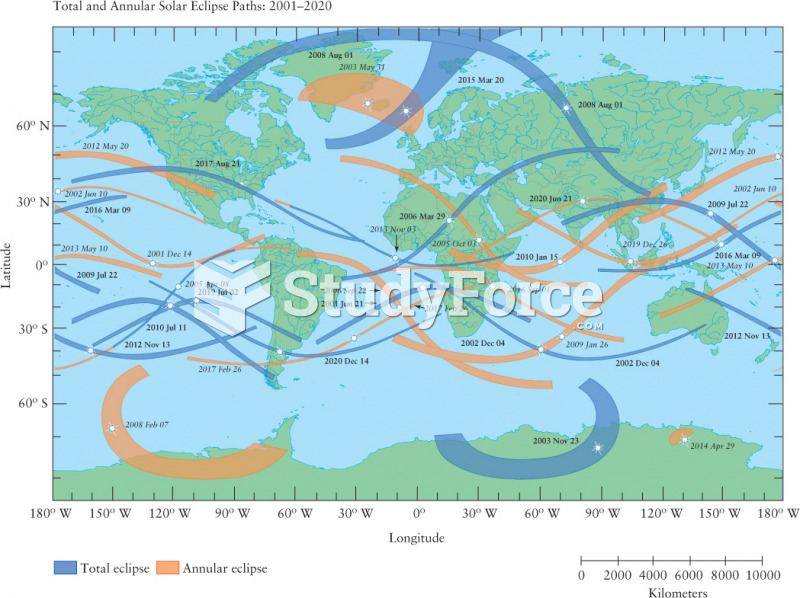 Eclipse Paths for Total and Annular Eclipses 2001–2020
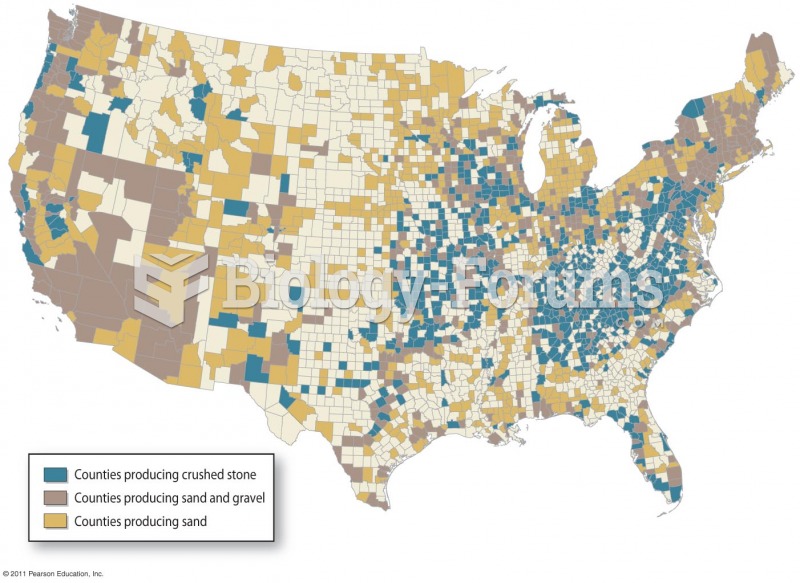 Distribution of Aggregate Mining
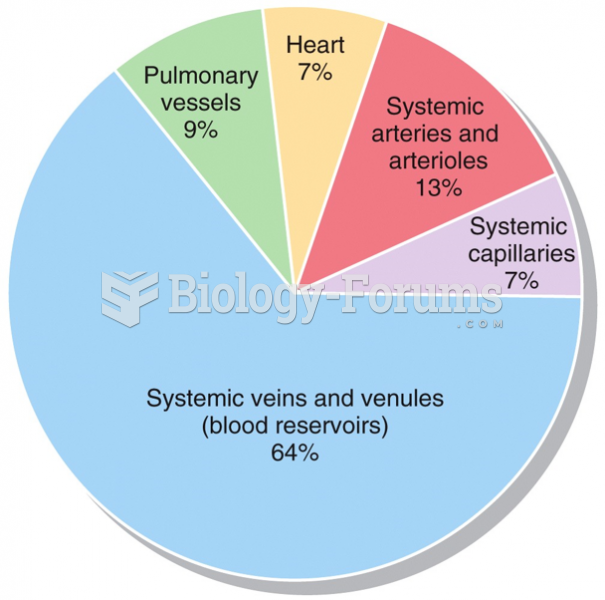 Blood Distribution
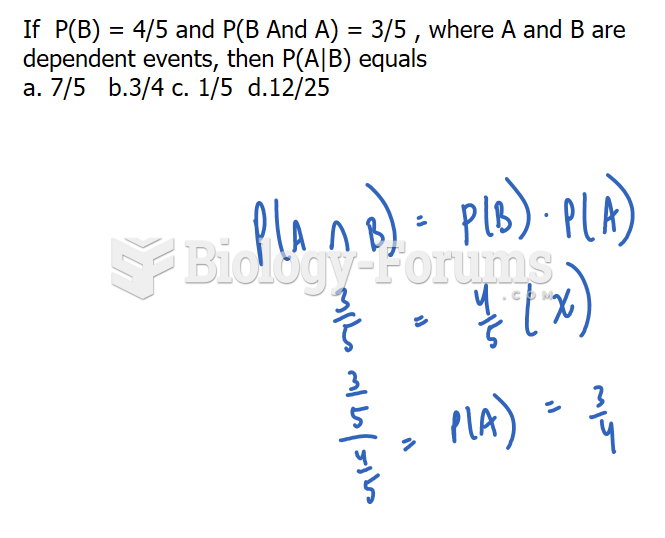 Probability Question
 How to analyse a pathological stage plot?
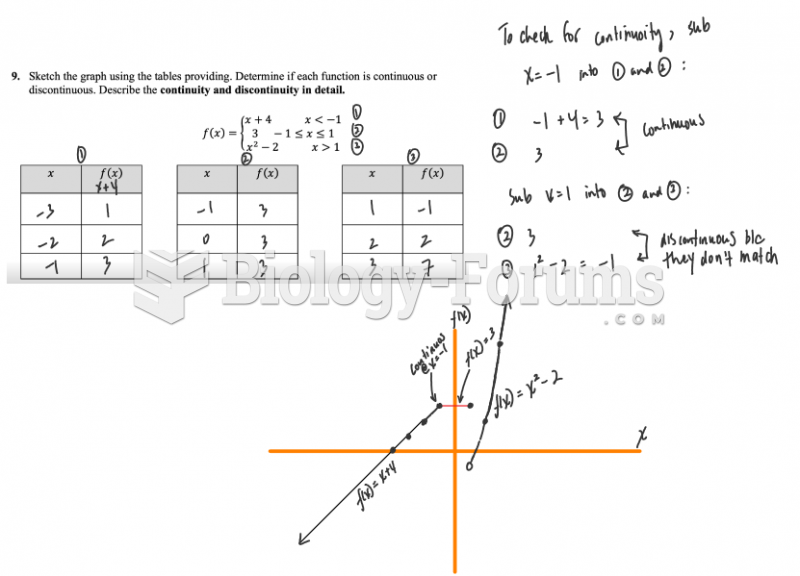 Sketch the graph using the tables providing. Determine if each function is continuous or ...