|
|
|

 False-color imagery of the Sun, a G-type main-sequence star, the closest to Earth.
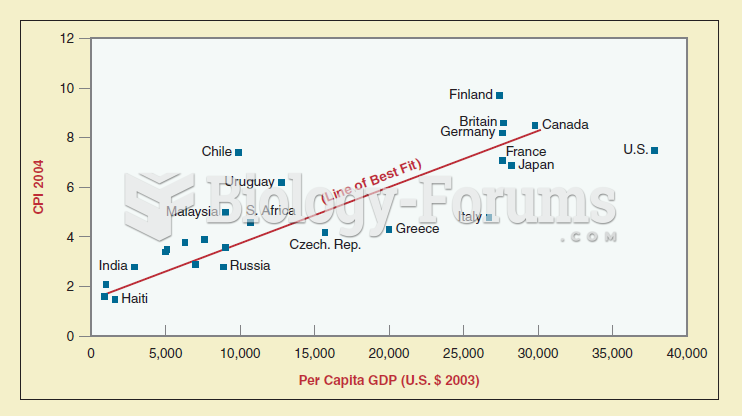 Scattergrams are a mechanism used by political scientists to show patterns and relationships among v
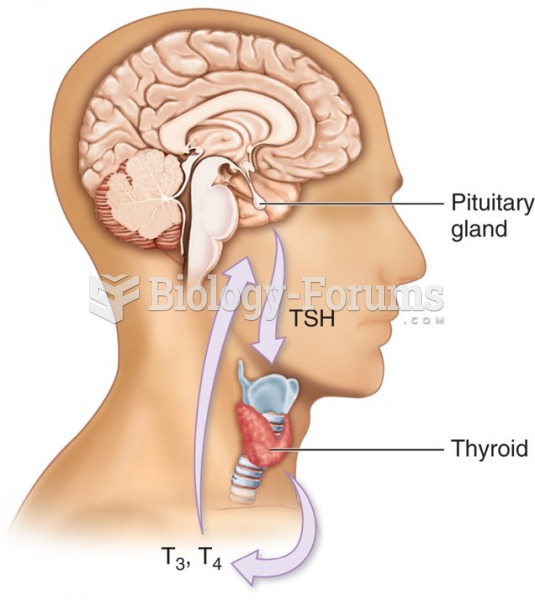 Thyroid hormone production—Relationship between pituitary and thyroid glands. Thyroid hormone ...
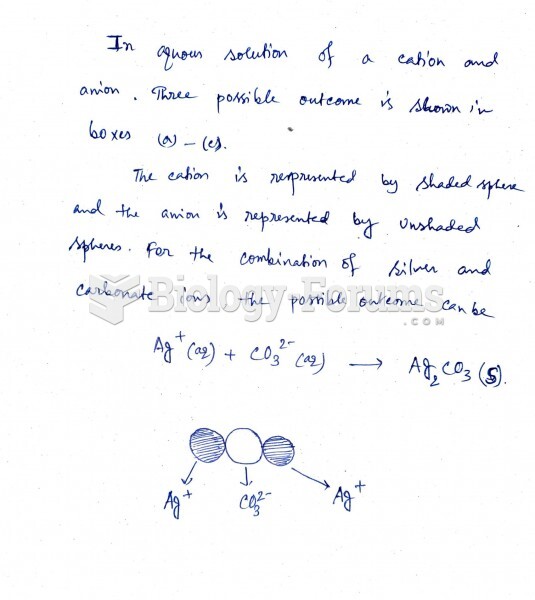 Which outcome corresponds to the combination of silver and carbonate ions shown in the ...
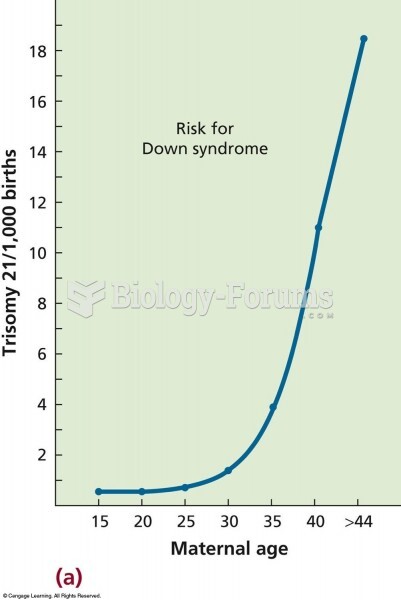 The relationship between maternal age and the frequency of trisomy 21 (Down syndrome). The risk incr
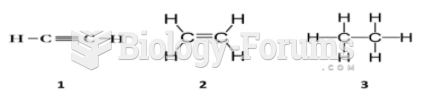 Which of the 3 structures shown below has the shortest bond length? Justify your answer.