Author Question: Why should a histogram contain no gaps between the bars but a bar chart may have gaps? What will ... (Read 135 times)

bobthebuilder

  • Hero Member
  • *****
  • Posts: 567
Why should a histogram contain no gaps between the bars but a bar chart may have gaps?
 
  What will be an ideal response?

Question 2

Explain why it is appropriate to connect the points on a line graph, but the points on a scatter plot should not be connected.
 
  What will be an ideal response?


milbourne11

  • Sr. Member
  • ****
  • Posts: 322
Answer to Question 1

A histogram is used to convey the distribution of a quantitative variable. The horizontal axis represents the range of possible values for the variable of interest. The bars are joined together to form the distribution. A bar chart is used to illustrate a qualitative variable. By using gaps between the bars, the differences between the categories are more easily seen.

Answer to Question 2

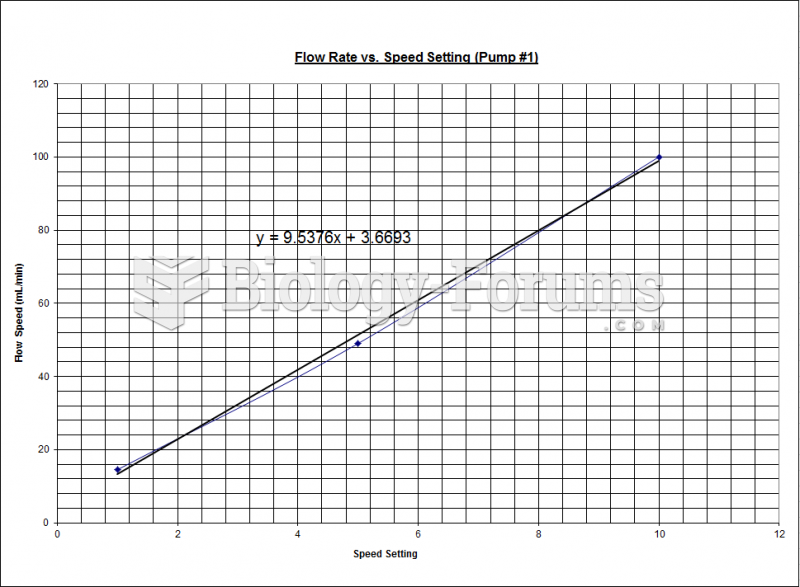
A line chart is used to display data that are measured in sequence over time. The points are in a defined order. Connecting the points serves to illustrate any trend that may be present in the data. A scatter plot is used to show the relationship between two variables. The XY data points are plotted in a two-dimensional space. The order that the XY points are recorded is of no consequence, so connecting the points would be meaningless.


Related Topics

Need homework help now?

Ask unlimited questions for free

Ask a Question


Did you know?

Normal urine is sterile. It contains fluids, salts, and waste products. It is free of bacteria, viruses, and fungi.

Did you know?

The cure for trichomoniasis is easy as long as the patient does not drink alcoholic beverages for 24 hours. Just a single dose of medication is needed to rid the body of the disease. However, without proper precautions, an individual may contract the disease repeatedly. In fact, most people develop trichomoniasis again within three months of their last treatment.

Did you know?

Ether was used widely for surgeries but became less popular because of its flammability and its tendency to cause vomiting. In England, it was quickly replaced by chloroform, but this agent caused many deaths and lost popularity.

Did you know?

Elderly adults are living longer, and causes of death are shifting. At the same time, autopsy rates are at or near their lowest in history.

Did you know?

More than one-third of adult Americans are obese. Diseases that kill the largest number of people annually, such as heart disease, cancer, diabetes, stroke, and hypertension, can be attributed to diet.

For a complete list of videos, visit our video library