Author Question: Why should a histogram contain no gaps between the bars but a bar chart may have gaps? What will ... (Read 142 times)

bobthebuilder

  • Hero Member
  • *****
  • Posts: 567
Why should a histogram contain no gaps between the bars but a bar chart may have gaps?
 
  What will be an ideal response?

Question 2

Explain why it is appropriate to connect the points on a line graph, but the points on a scatter plot should not be connected.
 
  What will be an ideal response?


milbourne11

  • Sr. Member
  • ****
  • Posts: 322
Answer to Question 1

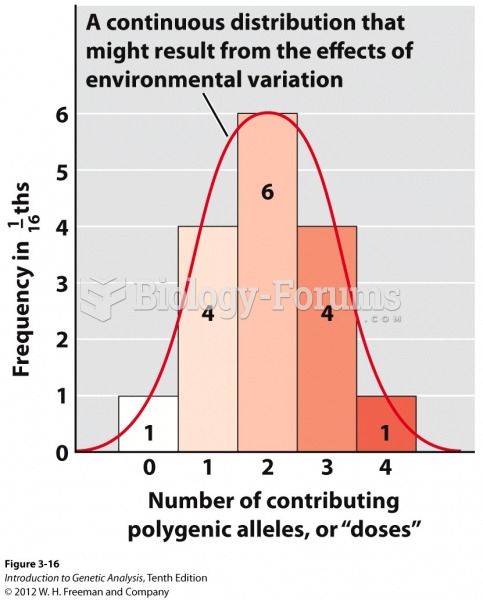
A histogram is used to convey the distribution of a quantitative variable. The horizontal axis represents the range of possible values for the variable of interest. The bars are joined together to form the distribution. A bar chart is used to illustrate a qualitative variable. By using gaps between the bars, the differences between the categories are more easily seen.

Answer to Question 2

A line chart is used to display data that are measured in sequence over time. The points are in a defined order. Connecting the points serves to illustrate any trend that may be present in the data. A scatter plot is used to show the relationship between two variables. The XY data points are plotted in a two-dimensional space. The order that the XY points are recorded is of no consequence, so connecting the points would be meaningless.


Related Topics

Need homework help now?

Ask unlimited questions for free

Ask a Question


Did you know?

Coca-Cola originally used coca leaves and caffeine from the African kola nut. It was advertised as a therapeutic agent and "pickerupper." Eventually, its formulation was changed, and the coca leaves were removed because of the effects of regulation on cocaine-related products.

Did you know?

Ether was used widely for surgeries but became less popular because of its flammability and its tendency to cause vomiting. In England, it was quickly replaced by chloroform, but this agent caused many deaths and lost popularity.

Did you know?

About 60% of newborn infants in the United States are jaundiced; that is, they look yellow. Kernicterus is a form of brain damage caused by excessive jaundice. When babies begin to be affected by excessive jaundice and begin to have brain damage, they become excessively lethargic.

Did you know?

During the twentieth century, a variant of the metric system was used in Russia and France in which the base unit of mass was the tonne. Instead of kilograms, this system used millitonnes (mt).

Did you know?

About 80% of major fungal systemic infections are due to Candida albicans. Another form, Candida peritonitis, occurs most often in postoperative patients. A rare disease, Candida meningitis, may follow leukemia, kidney transplant, other immunosuppressed factors, or when suffering from Candida septicemia.

For a complete list of videos, visit our video library