This topic contains a solution. Click here to go to the answer
|
|
|

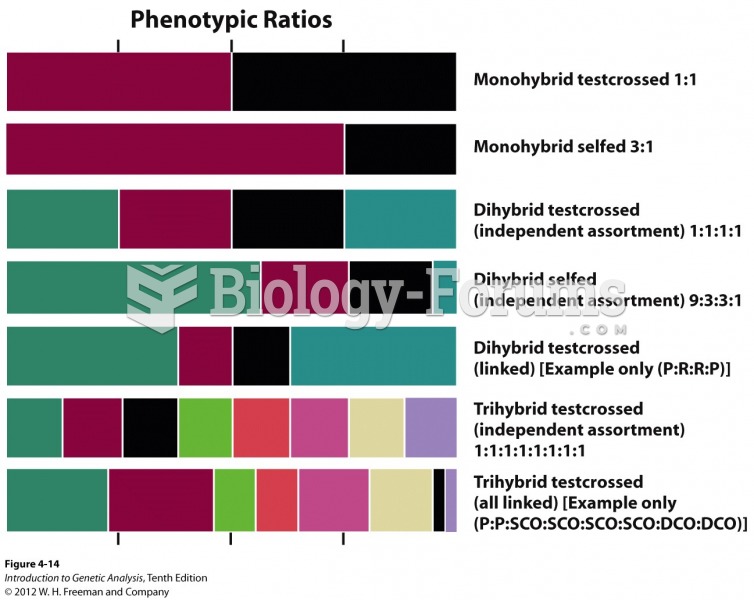 Phenotypic ratios in progeny reveal the type of cross
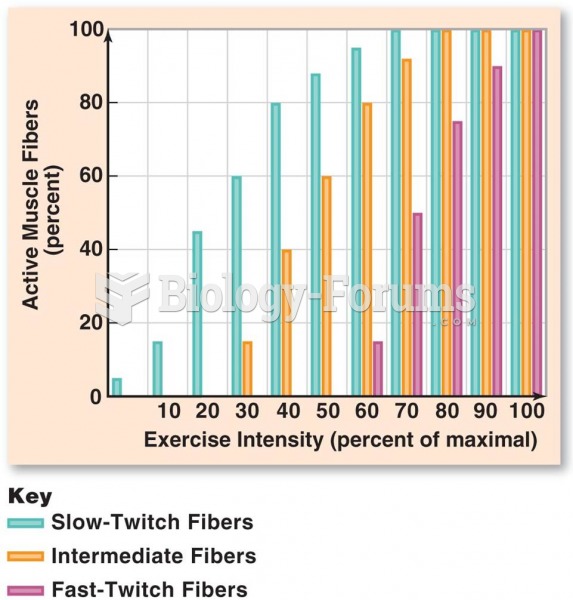 Recruitment of Muscle Fiber Type
 Comparison of Type 1 and Type 2 Diabetes Mellitus
 Basic molecular mechanisms of delayed-type hypersensitivity.
 Canada Total Energy Consumption by Fuel Type
 Bar-eye phenotypes in contrast to the wild-type eye in Drosophila