This topic contains a solution. Click here to go to the answer
|
|
|

 An onager, one type of wild ass
 A microsatellite locus can show linkage to a disease gene
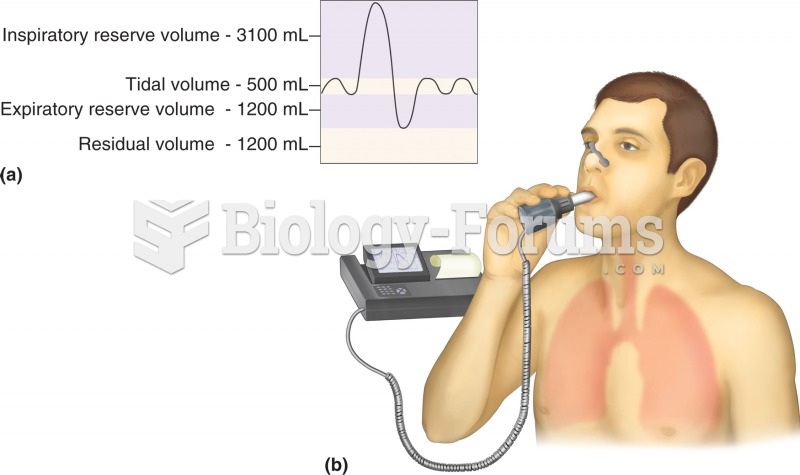 Pulmonary function test: spirometry. (a) Normal respiratory volumes, as measured during spirometry.
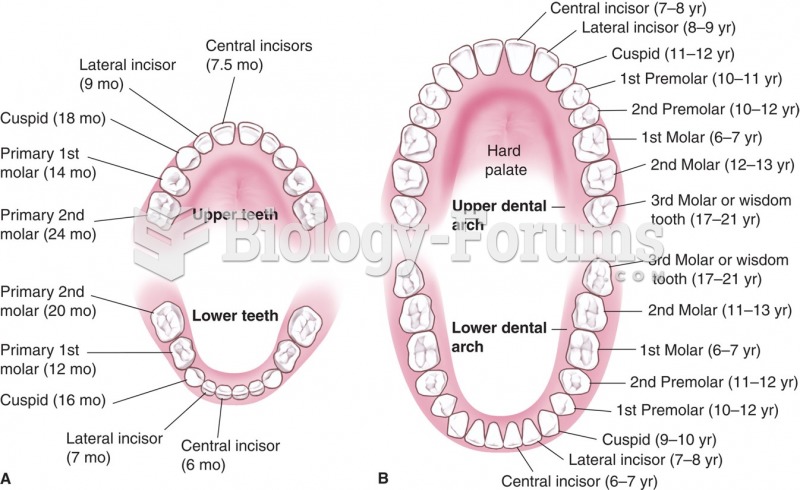 Deciduous and permanent teeth: (A) deciduous teeth, with the age at eruption given in months; (B) ...
 Profit-maximizing Chart
 For each chromosome type in the body, there are two copies. One is from the mother, and one is from