|
|
|

 The b-galactosdase chart
 Under what conditions can part-time employment in high school be a negative influence on school ...
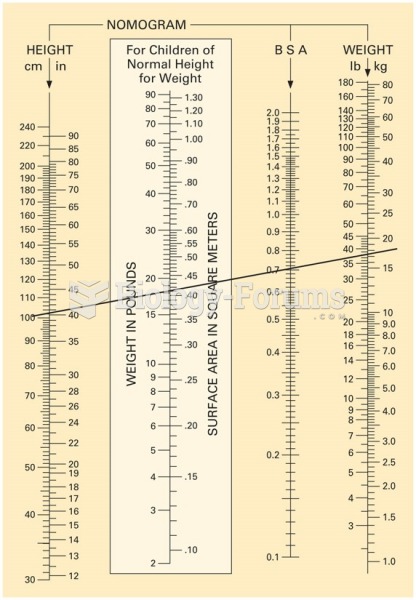 Nomogram chart. This example shows a line drawn from a child’s height of 100 cm to his weight, 35 ...
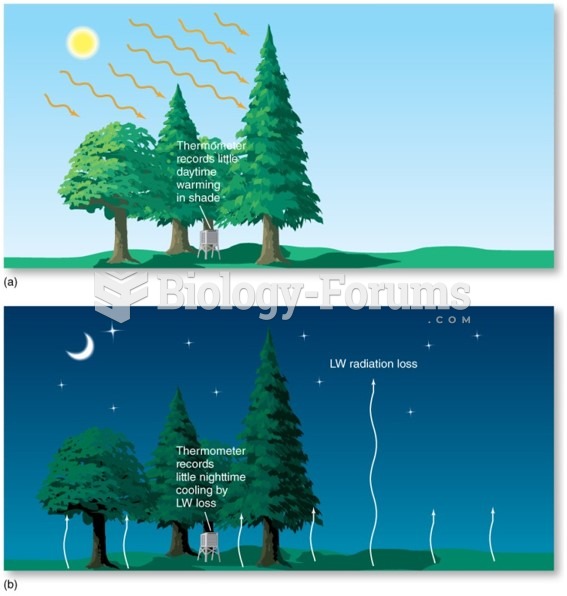 Daily and Annual Temperature Patterns
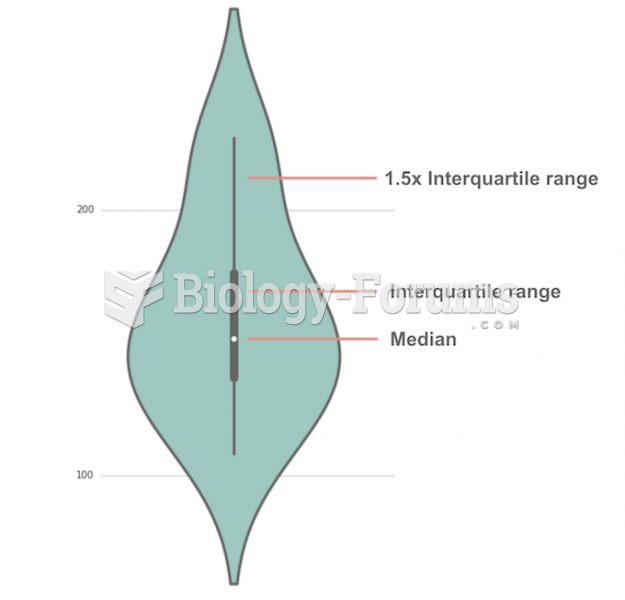 Violin Plot
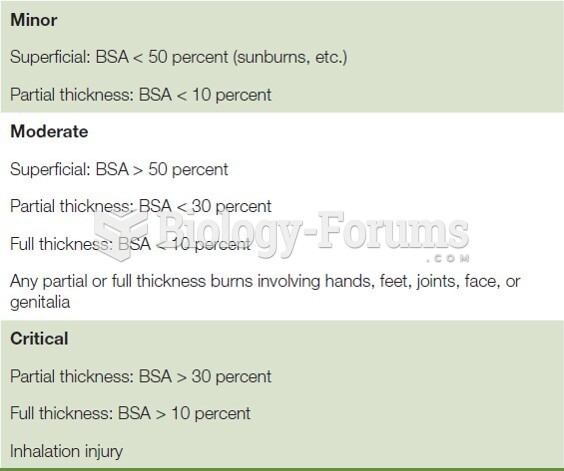 Burn Severity Chart