|
|
|

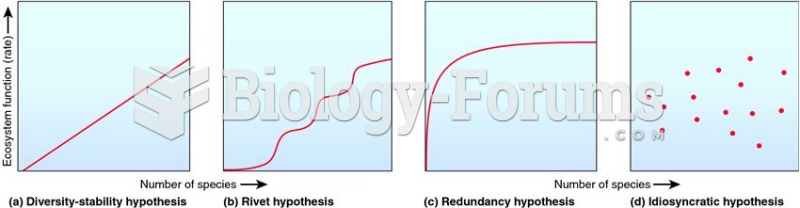 Four main models that describe the relationship between ecosystem function and biodiversity.
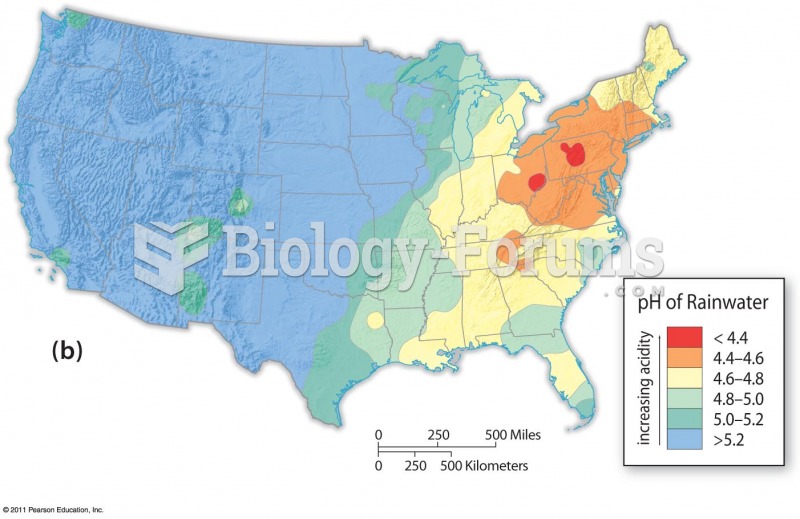 Acid Rain and Power Plant Emissions
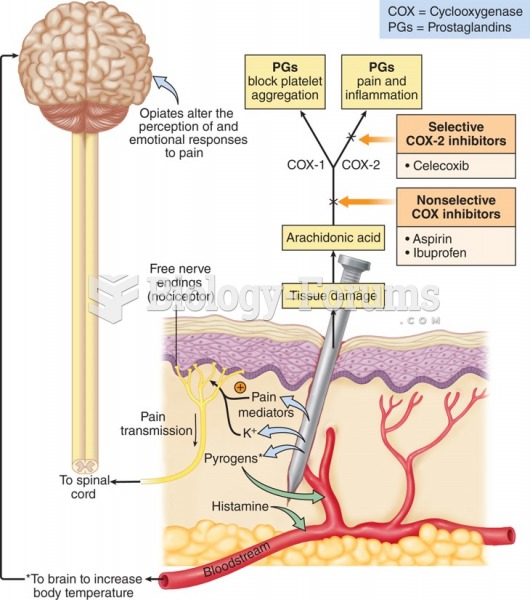 Mechanisms of pain at the nociceptor level.
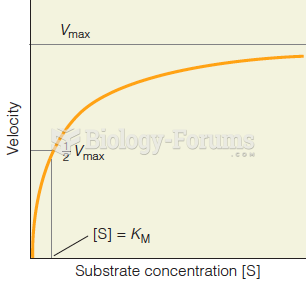 Reaction velocity as a function of substrate concentration
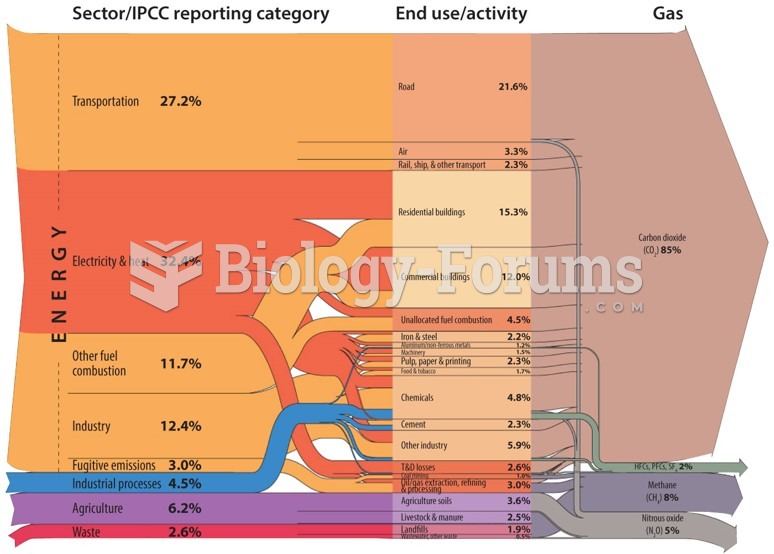 The level of emissions from transport in the United States is twice as high as the global average
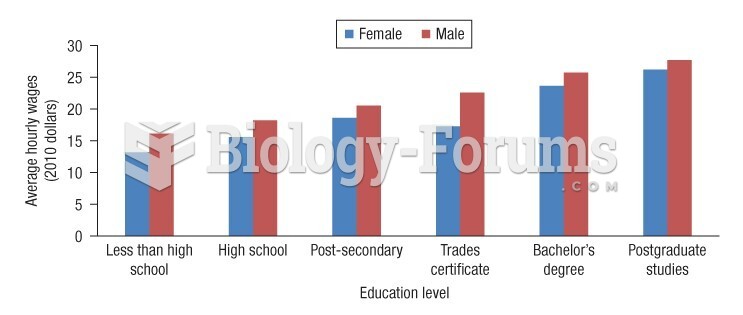 Average real hourly wages (2010 dollars) by education level, full-time workers aged 17 to 34 in 2011