This topic contains a solution. Click here to go to the answer
|
|
|

 Ancient Greek rhyton in the shape of a dog's head
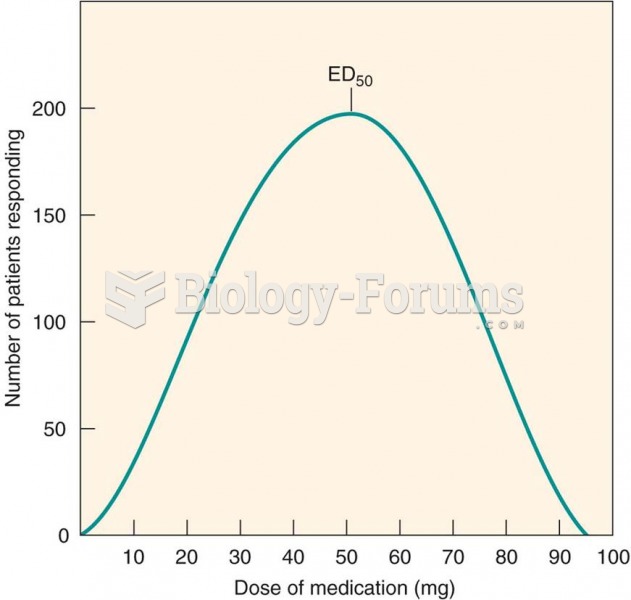 Frequency distribution curve: interpatient variability in drug response
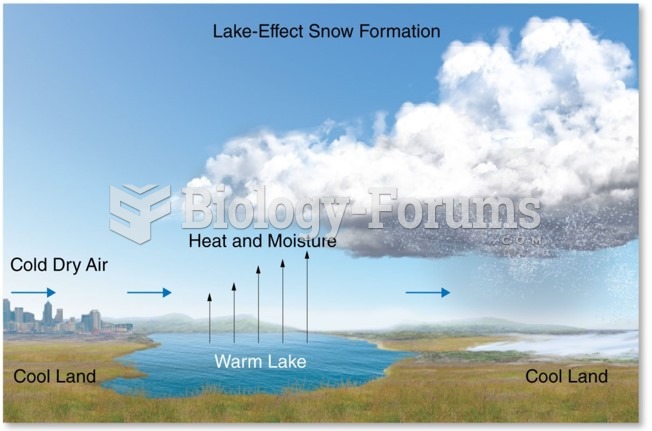 Distribution and Forms of Precipitation: Snow
 Distribution and Forms of Precipitation: Freezing Rain
 Distribution of Thunderstorms: Approximately 14.5 million thunderstorms occur each year across the ...
 Spacecraft optimum geometrical shape