This topic contains a solution. Click here to go to the answer
|
|
|

 Functionalist and Conflict Views of Stratification: The Distribution of Society's Resources
 The typical distribution of neurofibrillary tangles and amyloid plaques in the brains of patients ...
 Distribution and Forms of Precipitation: Snow
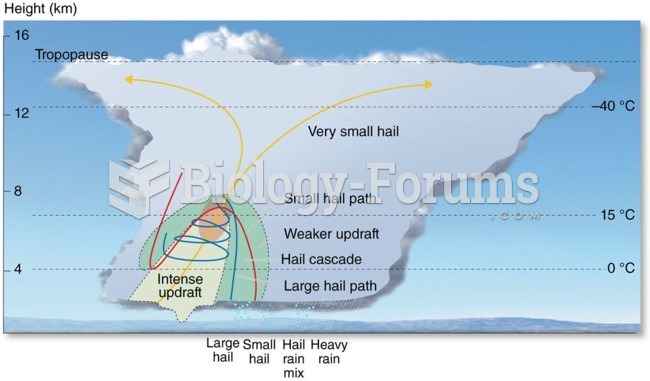 Distribution and Forms of Precipitation: Graupel and Hail
 How to perform the concavity test and second derivative test for a function (Part 2)
 Prove that each of the following real functions f has a discontinuity. For each function, ...