This topic contains a solution. Click here to go to the answer
|
|
|

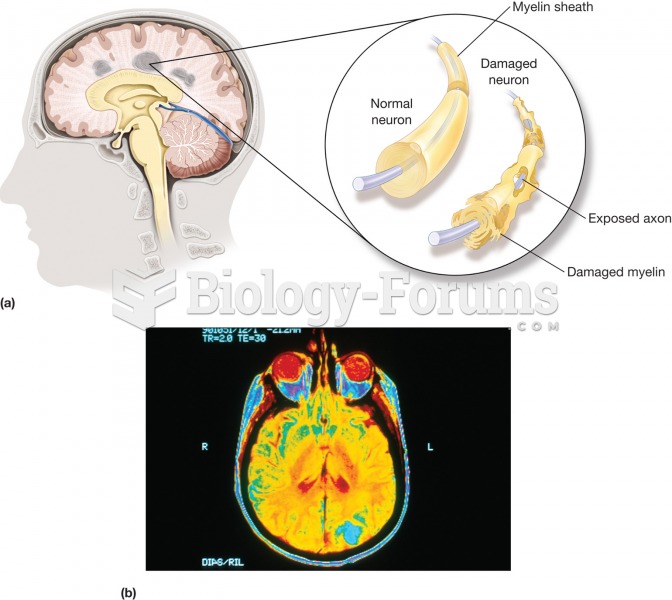 Multiple sclerosis (MS). (a) A disease characterized by the gradual development of small areas of ha
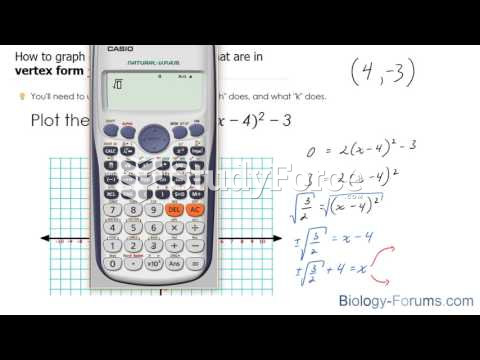 How to graph quadratic equations that are in vertex form
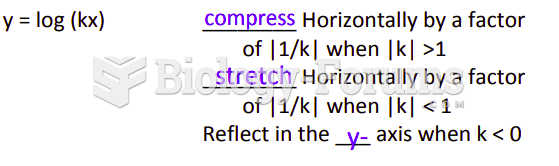 Given the parent function f(x)=log10(bottom exponent)x, state the equation of the function that
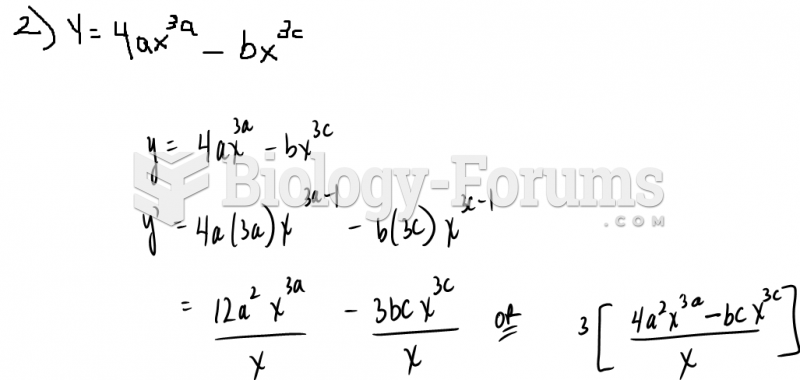 Differentiate each function with respect to x. (Power rule)
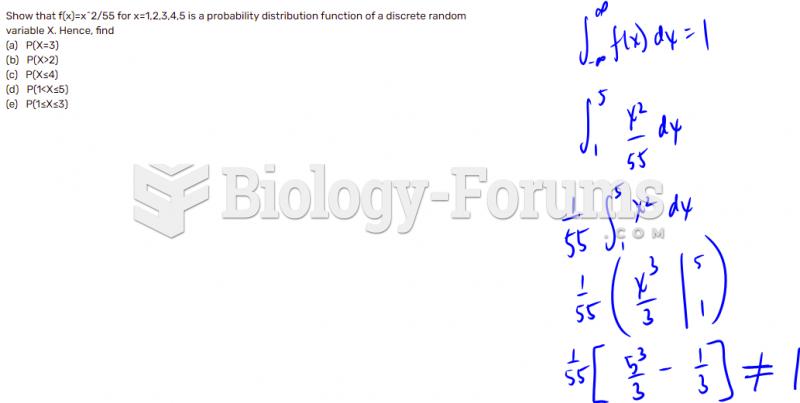 Discrete random variables- Probability Distribution Function
 calculus homework graph help please