This topic contains a solution. Click here to go to the answer
|
|
|

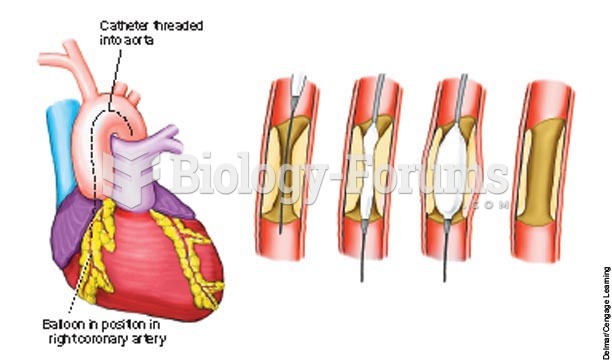 Demonstration of the function of a balloon-tipped catheter during a PTCA procedure.
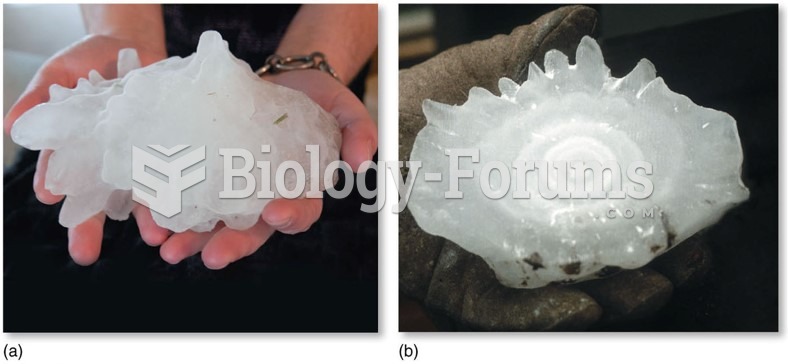 Distribution and Forms of Precipitation: Graupel and Hail
 How to sketch a cubic function using transformations
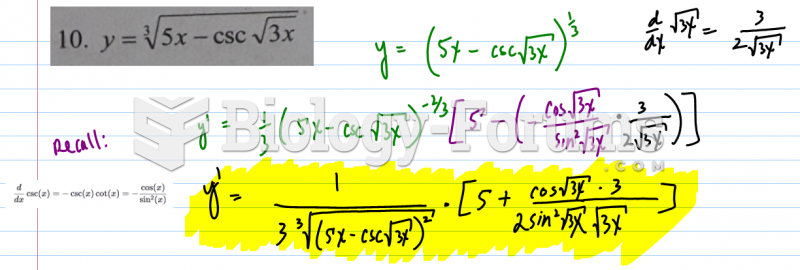 Derivative of Trig Function
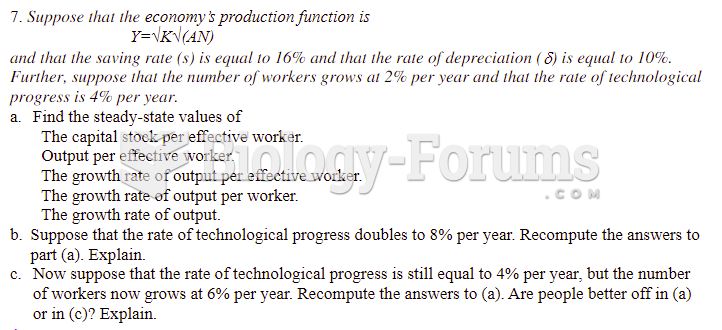 Consider the production function ( ) 0.5 0.5 Y = AK L . Suppose both saving rate (s) and the ...
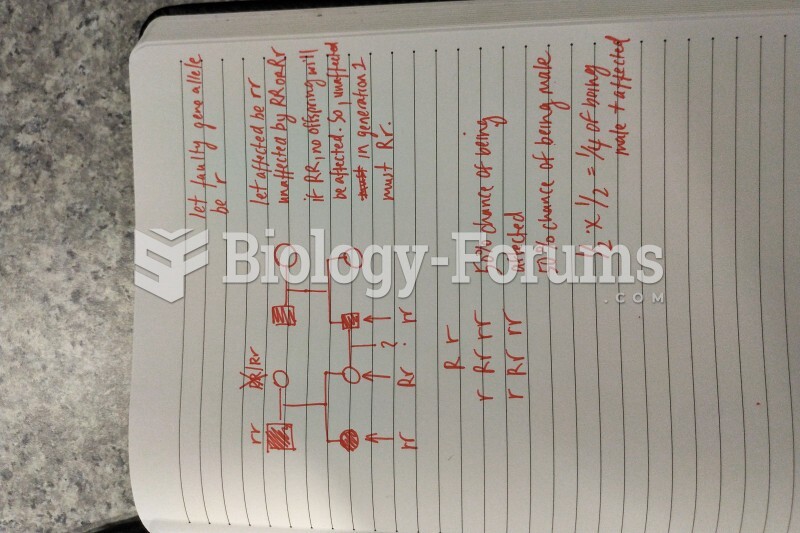 Pedigree Probability