|
|
|

 A melanistic jaguar is a colour morph which occurs at about 6% frequency in populations.
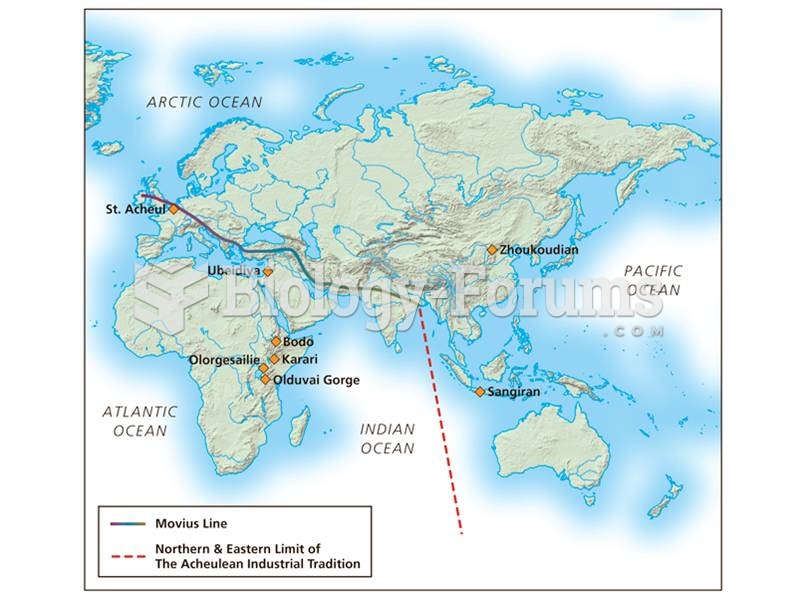 The Movius line separates regions of the world where Acheulean hand axes were made from regions wher
 Generalized scheme showing the contribution of absorption, distribution, metabolism, elimination, ...
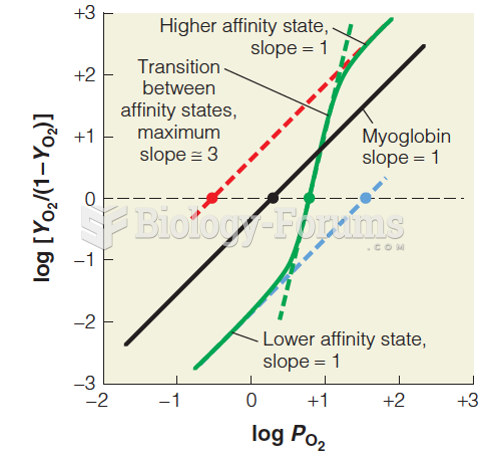 Hill plots of oxygen binding for myoglobin and hemoglobin under physiological conditions
 A spaceship leaves Earth at a steady forward speed of 70% the speed of light. How fast relative ...
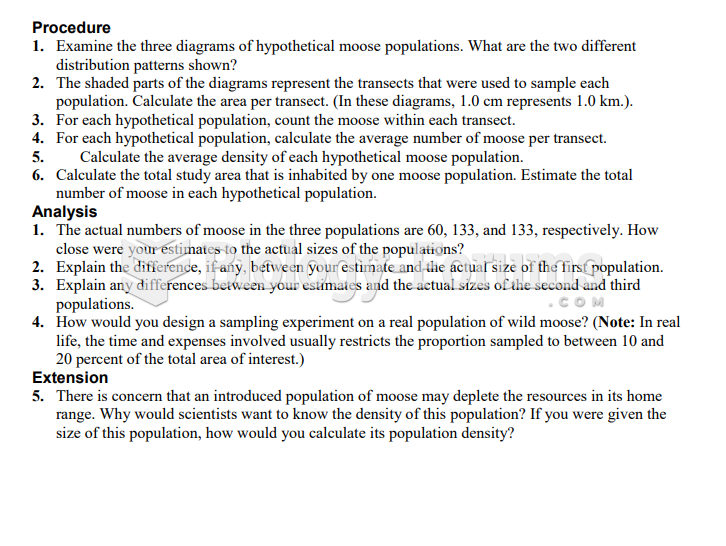 Distribution Patterns and Population Size Estimates (Bio 30)