|
|
|
Vampire bats have a natural anticoagulant in their saliva that permits continuous bleeding after they painlessly open a wound with their incisors. This capillary blood does not cause any significant blood loss to their victims.
The human body's pharmacokinetics are quite varied. Our hair holds onto drugs longer than our urine, blood, or saliva. For example, alcohol can be detected in the hair for up to 90 days after it was consumed. The same is true for marijuana, cocaine, ecstasy, heroin, methamphetamine, and nicotine.
Pubic lice (crabs) are usually spread through sexual contact. You cannot catch them by using a public toilet.
Pregnant women usually experience a heightened sense of smell beginning late in the first trimester. Some experts call this the body's way of protecting a pregnant woman from foods that are unsafe for the fetus.
Warfarin was developed as a consequence of the study of a strange bleeding disorder that suddenly occurred in cattle on the northern prairies of the United States in the early 1900s.
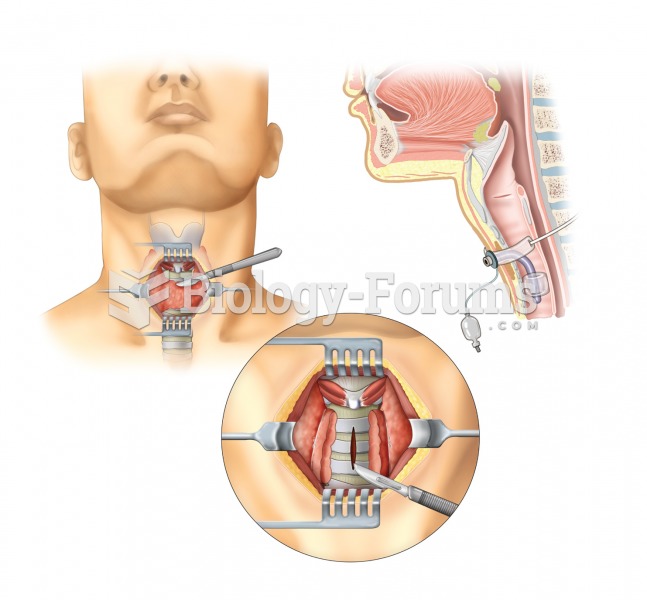
 Tracheostomy. A tracheotomy, or incision into the trachea, is performed to create an opening into th
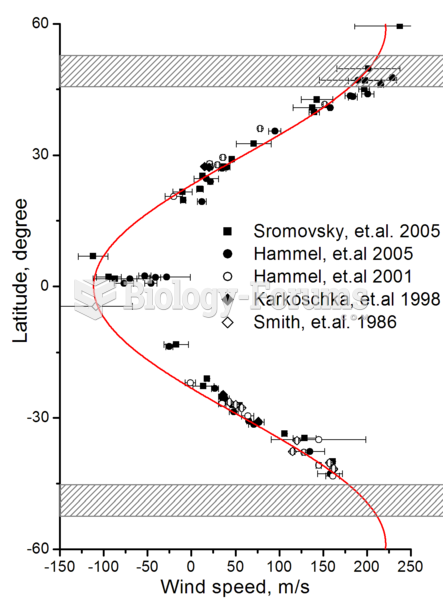
 Zonal wind speeds on Uranus. Shaded areas show the southern collar and its future northern counterpa
 Empathy draws a more positive response from the patient because it is based on the willingness of th
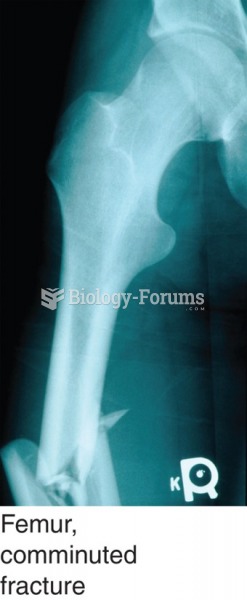
 Fractures are diagnosed based on an X-ray of the broken bone. Shown here: a comminuted fracture of ...


