|
|
|

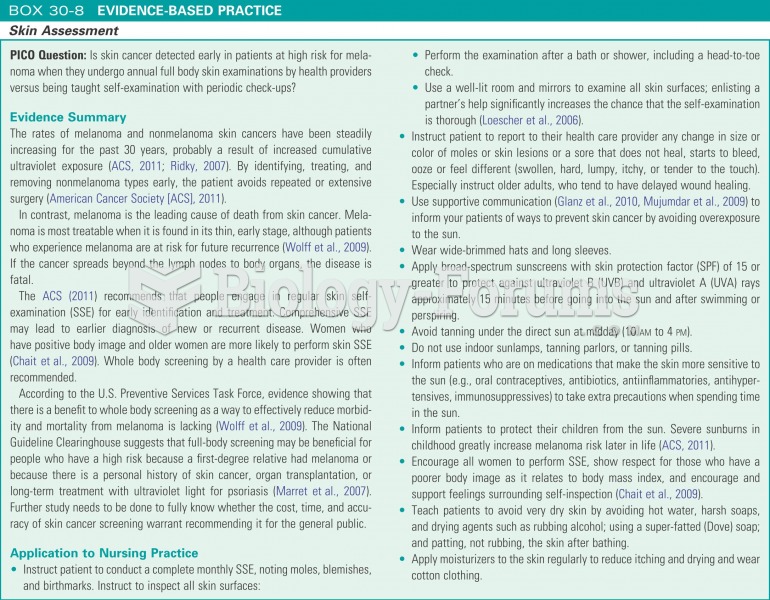 Evidence-based practice: skin assessment
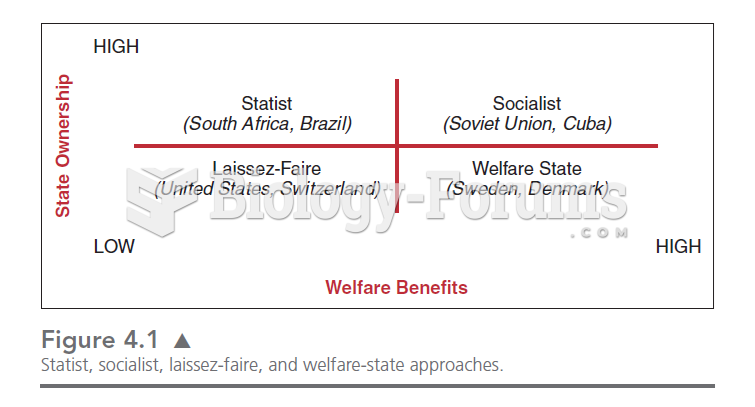 This chart illustrates the four quadrants in which we can place the relationships between the state
 The gaping hole in the destroyer USS Cole, in the port of Aden, Yemen, was the work of suicide bombe
 How to count for the correct number of significant digits
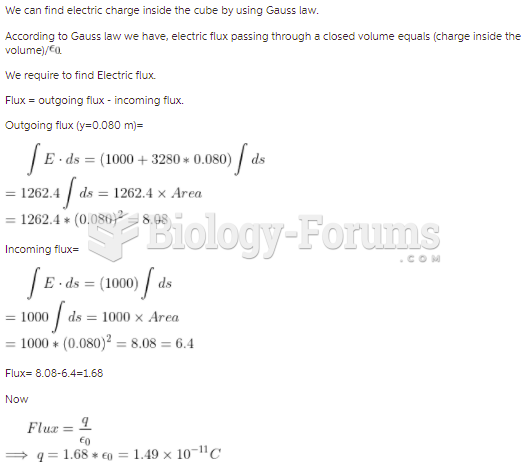 The cube of insulating material shown in the figure has one corner at the origin. Each side of ...
 Genome-wide SNP-based heritability for individual behavioral disorders