|
|
|

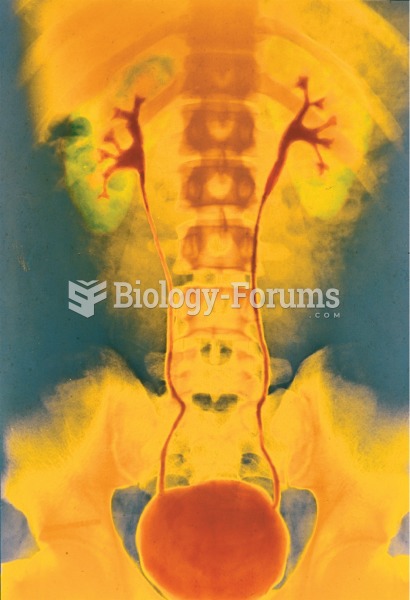 Retrograde pyelogram. A contrast medium is injected into the ureter using a cystoscope, and the X-ra
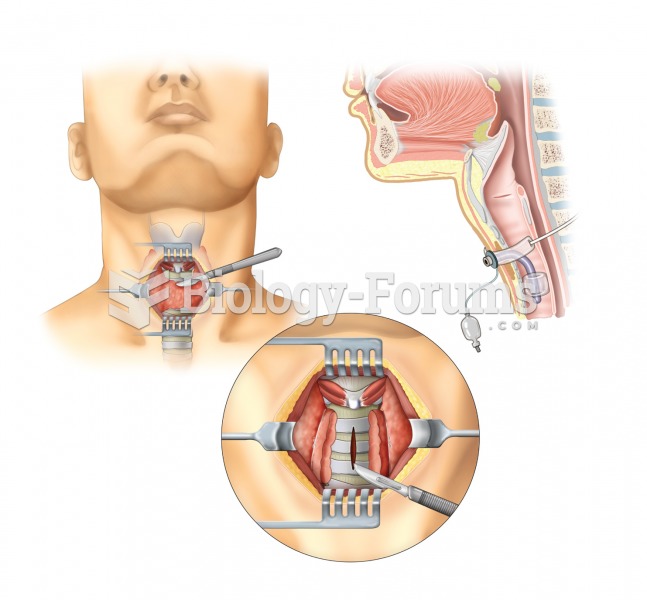 Tracheostomy. A tracheotomy, or incision into the trachea, is performed to create an opening into th
 To maintain global power requires the continuous development of weapons. Shown here is the Osprey. ...
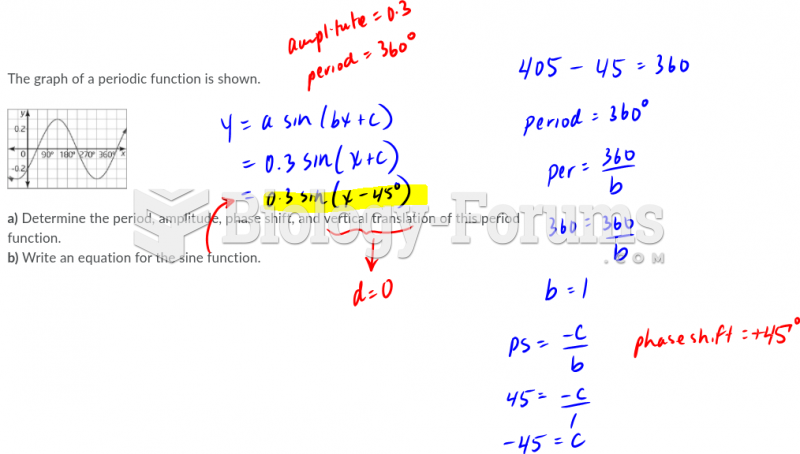 Look at the graph function shown belowPlea
 Linkage Data from 39 Families with Cystic Fibrosis