This topic contains a solution. Click here to go to the answer
|
|
|

 Apple iPhone 3G, as displayed in Toronto.
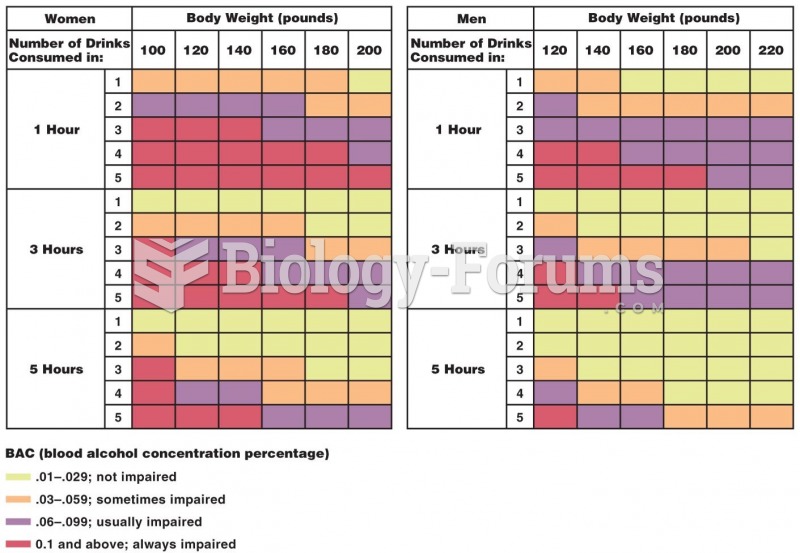 BAC Chart
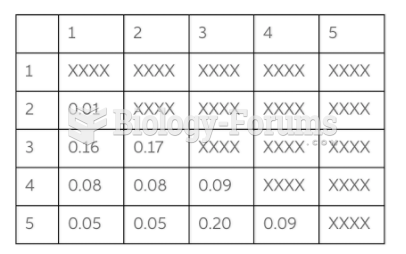
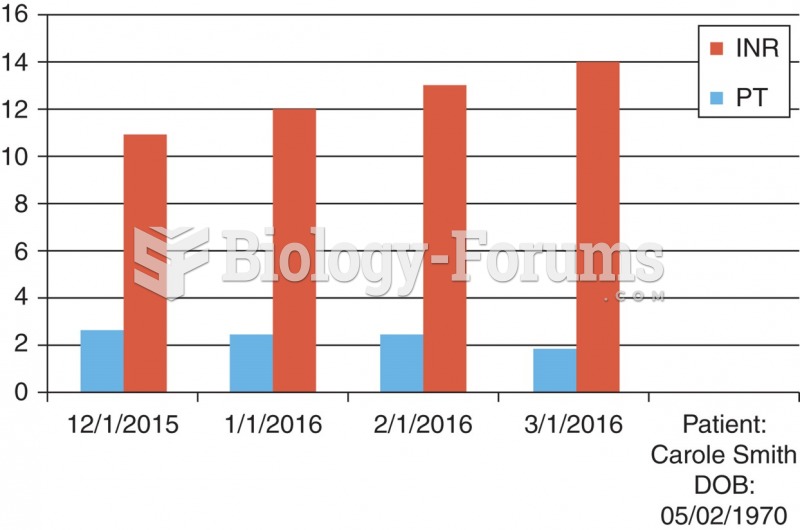 A chart derived from a flow sheet.
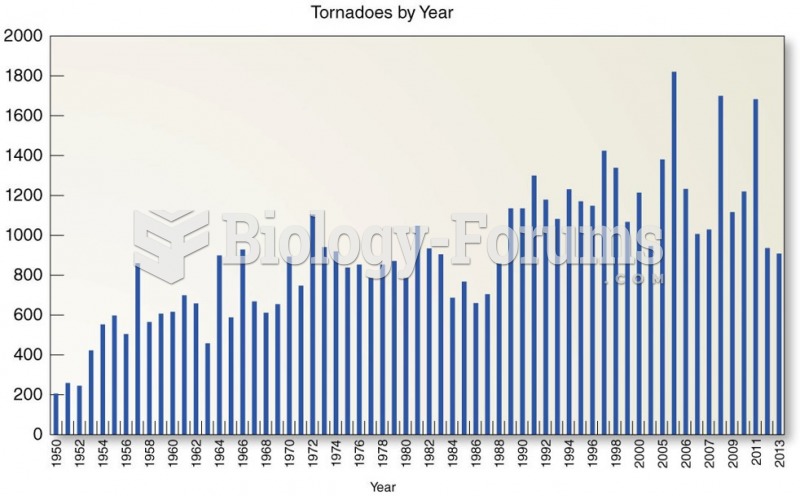 Trends in U.S. Tornado Occurrence
 Chart
Chart
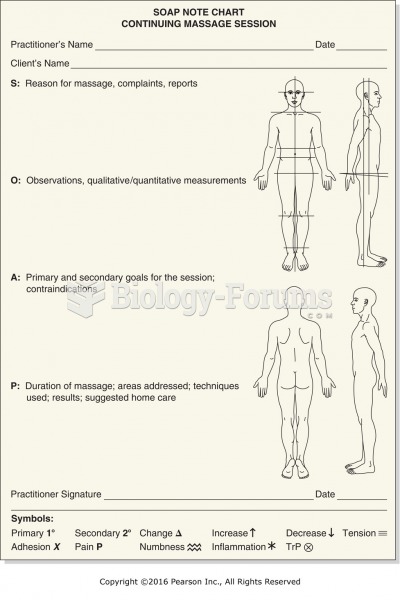 Example of SOAP chart with body diagram.