This topic contains a solution. Click here to go to the answer
|
|
|

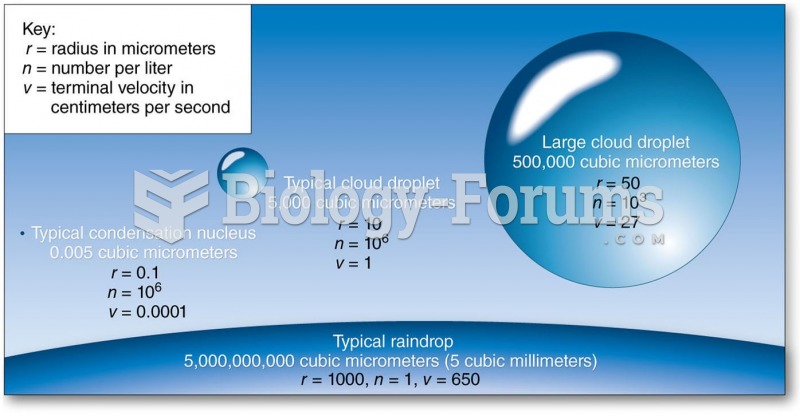 Growth of Cloud Droplets
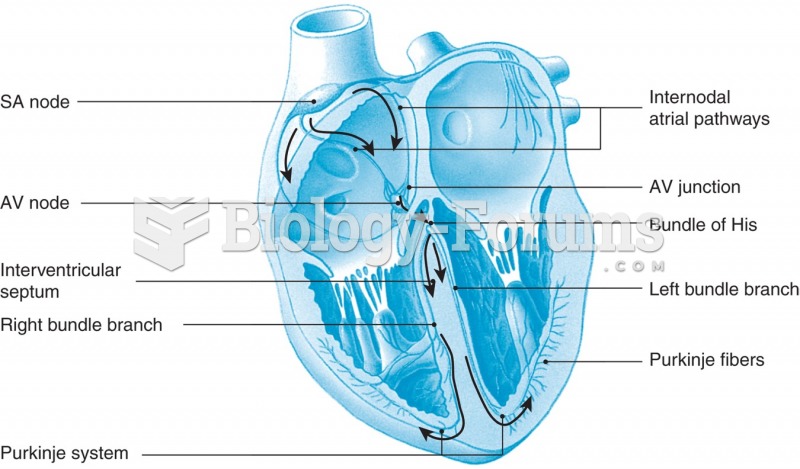 Diagram of the heart showing normal conduction pathway.
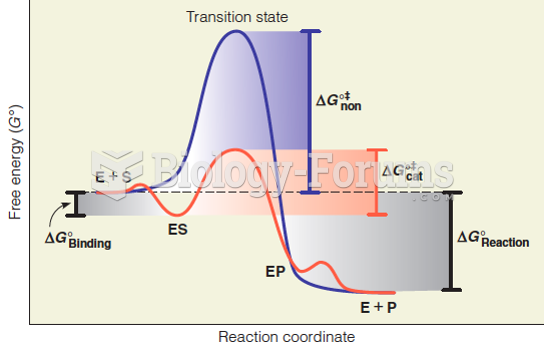 Reaction coordinate diagram for a simple enzyme catalyzed reaction
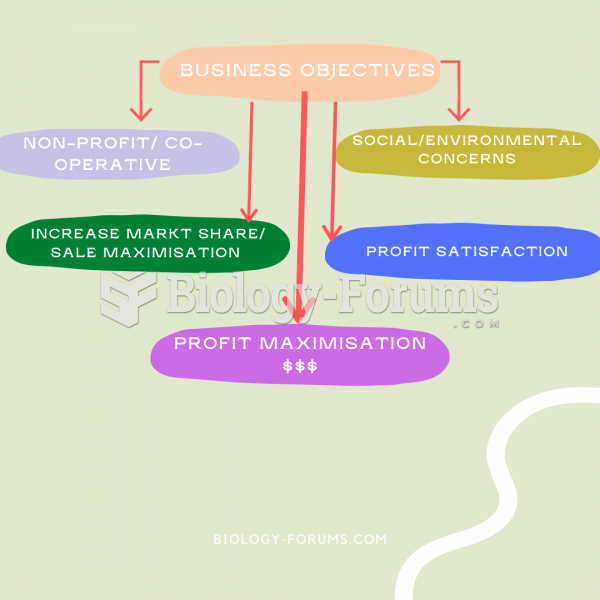 Economic objectives of firms
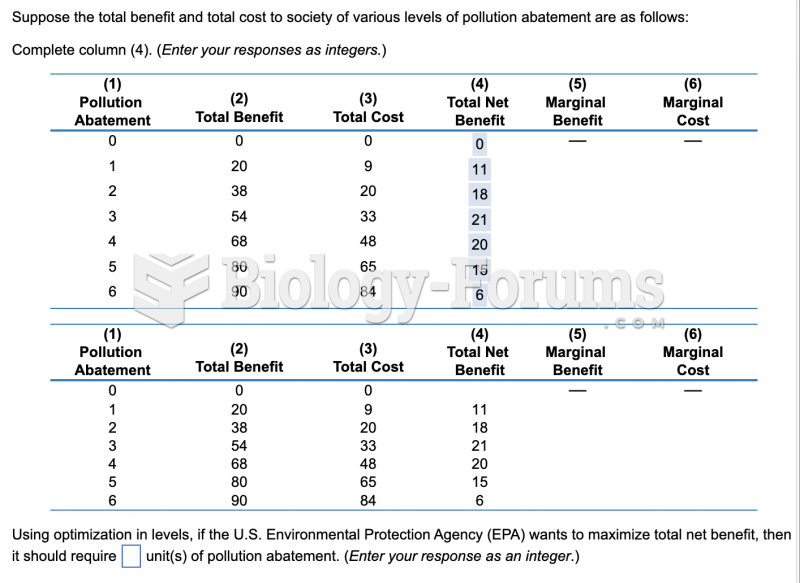 economic question
 Production of prototrophs as a result of genetic recombination