This topic contains a solution. Click here to go to the answer
|
|
|

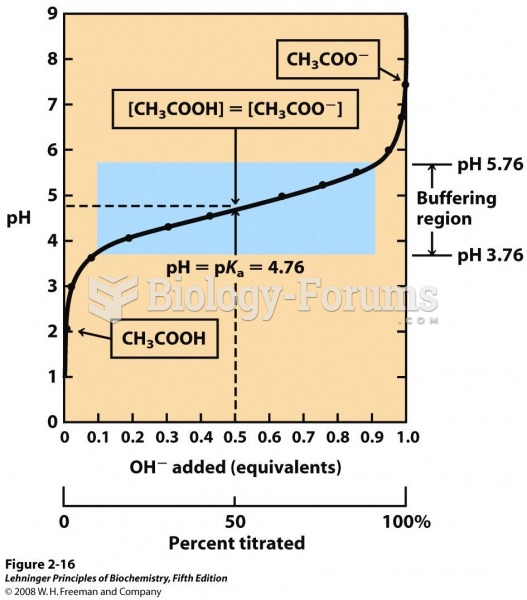 The titration curve of acetic acid
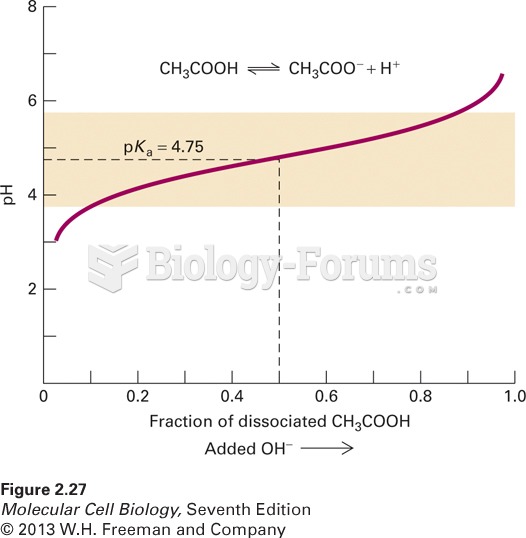 The titration curve of the buffer acetic acid (CH3COOH)
 Demonstrate the Application of Triangular, Figure-Eight, and Tubular Bandages
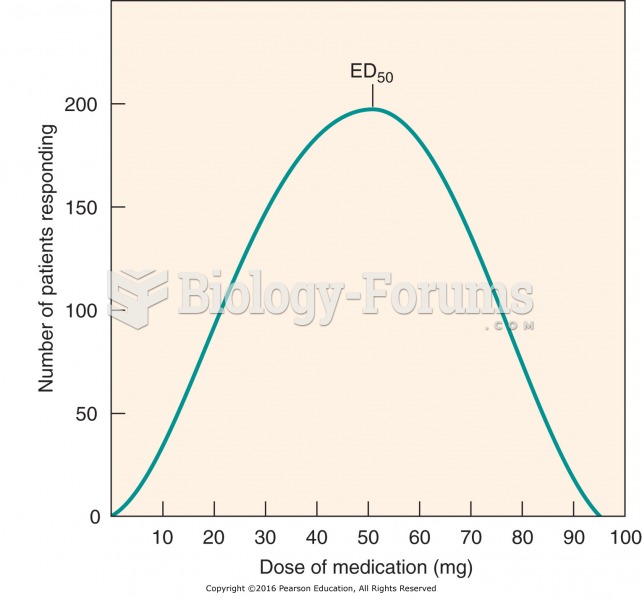 Frequency distribution curve: interpatient variability in drug response.
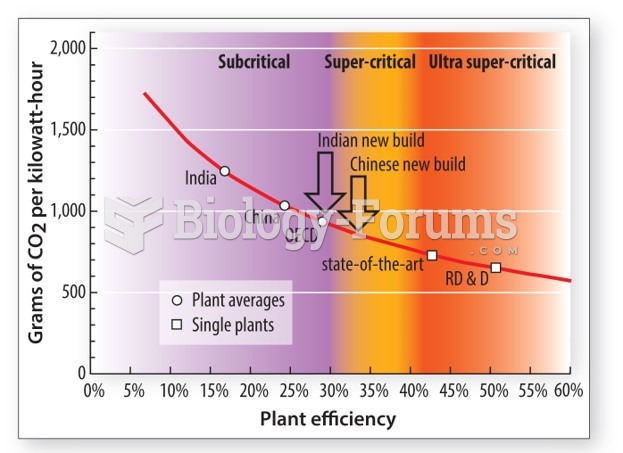 The production of electricity from coal is inefficient
 The circadian rhythm is a wave-like curve