Refer to Table 20-8. Suppose that the data in the table above reflect the price levels in the economy. What is the inflation rate in between 2015 and 2016?
A) 2 B) 5 C) 10 D) 12 E) 20
Question 2
The long-run aggregate supply curve shows the relationship between
A) short-run aggregate supply and short-run aggregate demand.
B) the quantity of real GDP supplied and the quantity of nominal GDP supplied.
C) the real interest rate and the nominal interest rate.
D) the price level and quantity of real GDP supplied.

 X ray diffraction of beads on a string at different levels
 Summary of US Census Data
 Apply draining stroke to forearm. Hold forearm off of the table with one hand. With the other hand, ...
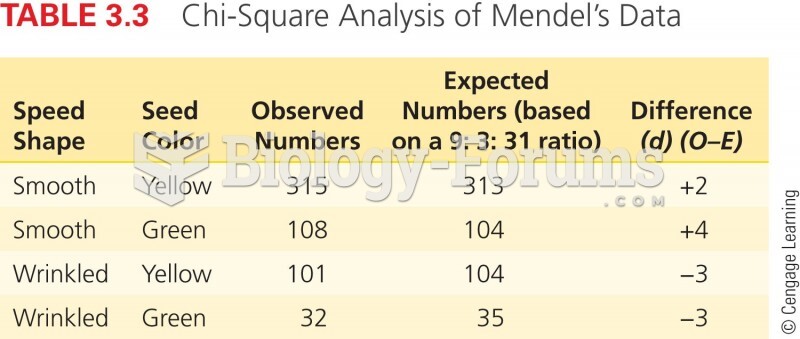 Chi-Square Analysis of Mendel's Data
 Table - Correlation Analysis
 Table salt.