This topic contains a solution. Click here to go to the answer
|
|
|

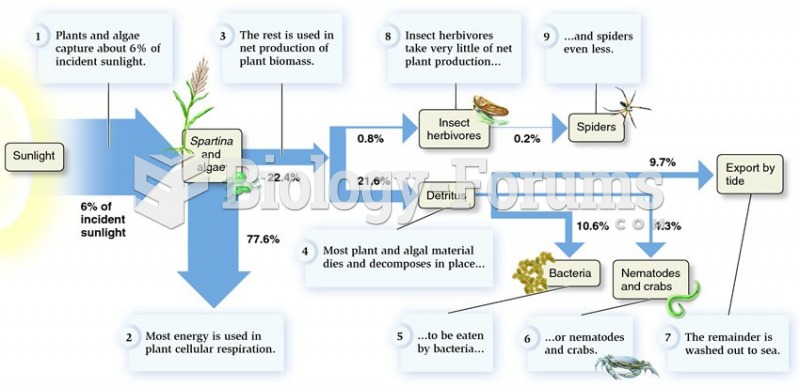 Energy-flow diagram for a Georgia salt marsh.
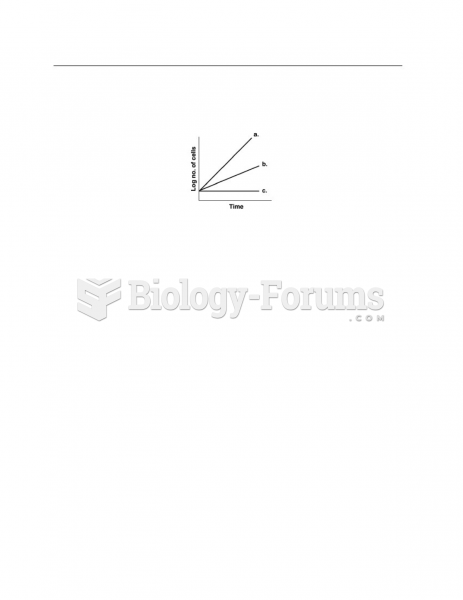 Facultative Anaerobe Diagram
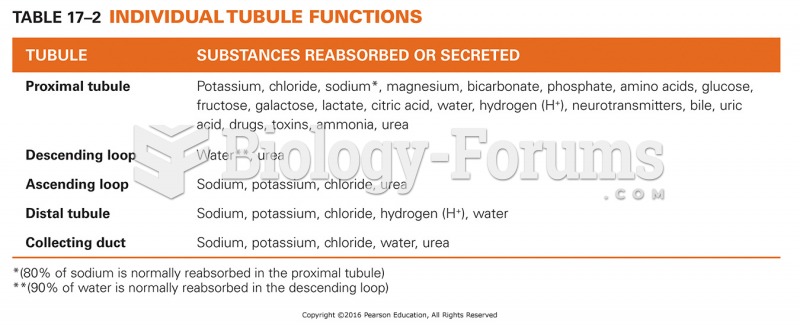 Individual Tubule Functions
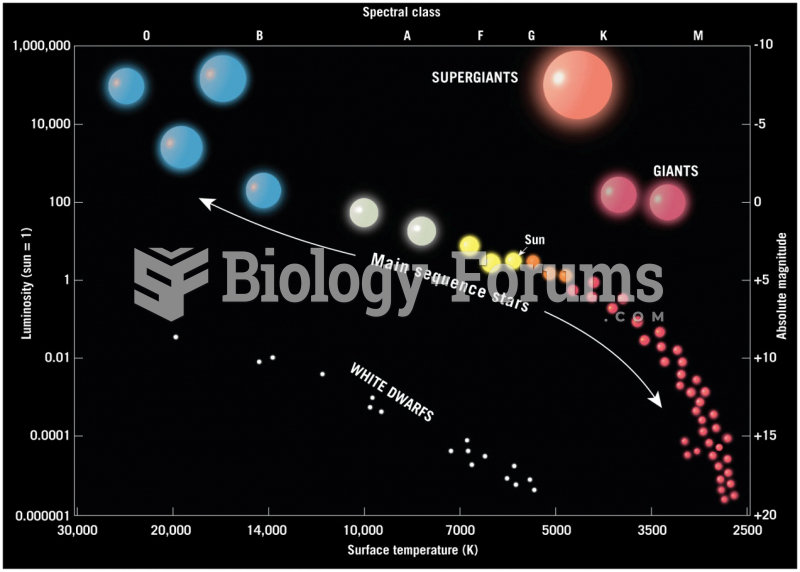 Hertzsprung-Russell Diagram
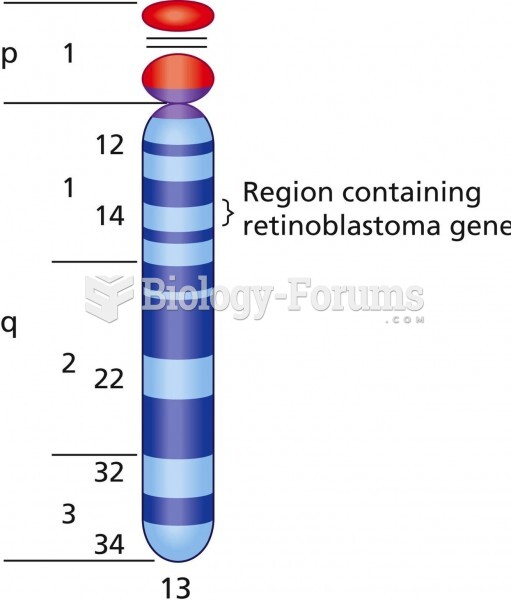 A diagram of chromosome 13, showing the retinoblastoma (RB1) locus
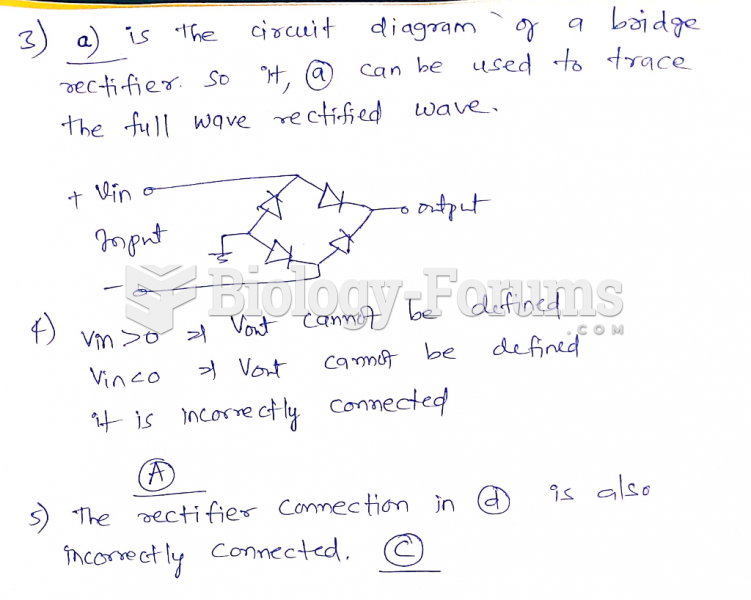 Refer to (d) in the figure above. This rectifier arrangement