|
|
|

 Changes in boreal forest composition along a chronosequence in Quebec. Dates refer to the year of th
 Historian James Merrell notes several errors in Benjamin West’s famous 1771 painting, William Penn’s
 Demonstrate the Application of Triangular, Figure-Eight, and Tubular Bandages
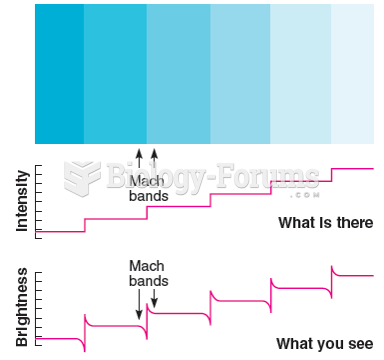 The illusory bands visible in this figure are often called Mach bands, although Mach used a ...
 EYEMA-O-BYERI (Reliquary Figure)
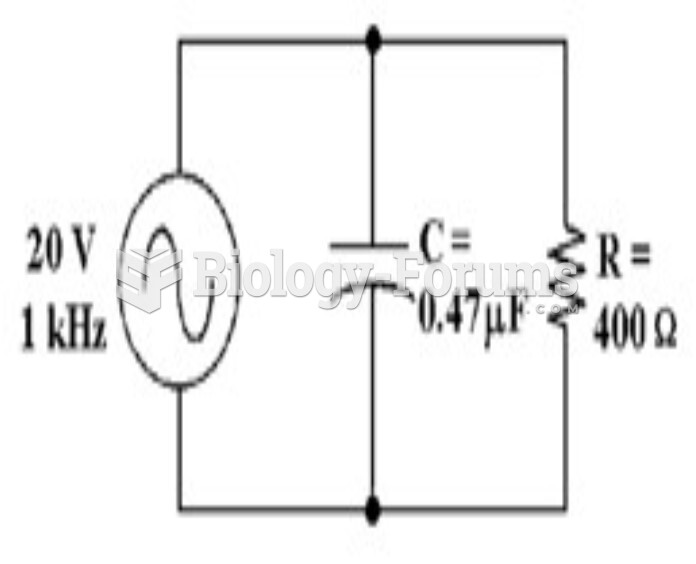 How much voltage does the resistor drop in Figure 10-2?