|
|
|

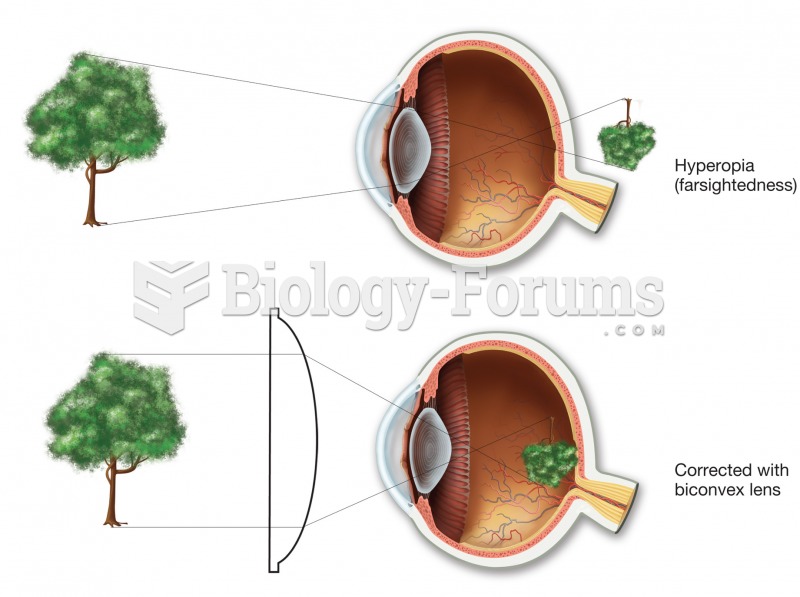 Hyperopia (farsightedness). In the uncorrected top figure, the image would come into focus behind th
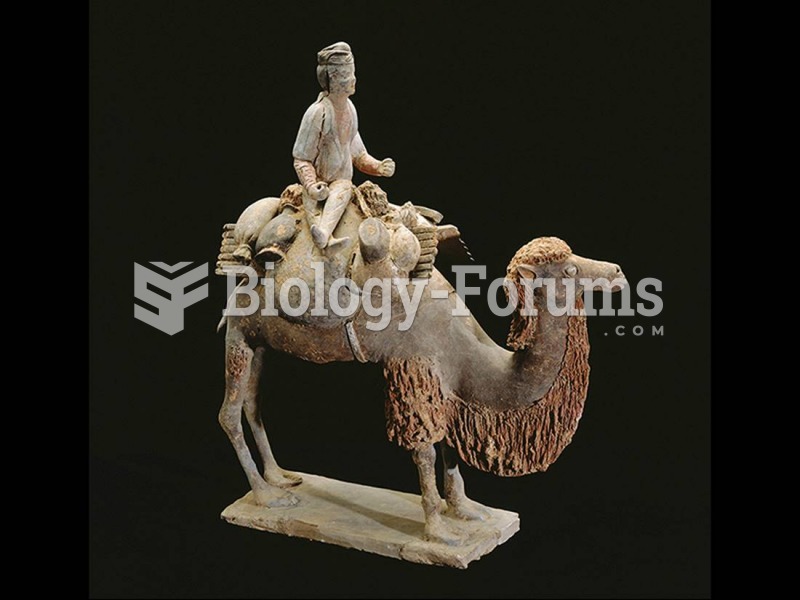 Caravaneer on a camel, China. Tang dynasty, (618–907). Polychrome terra-cotta figure.
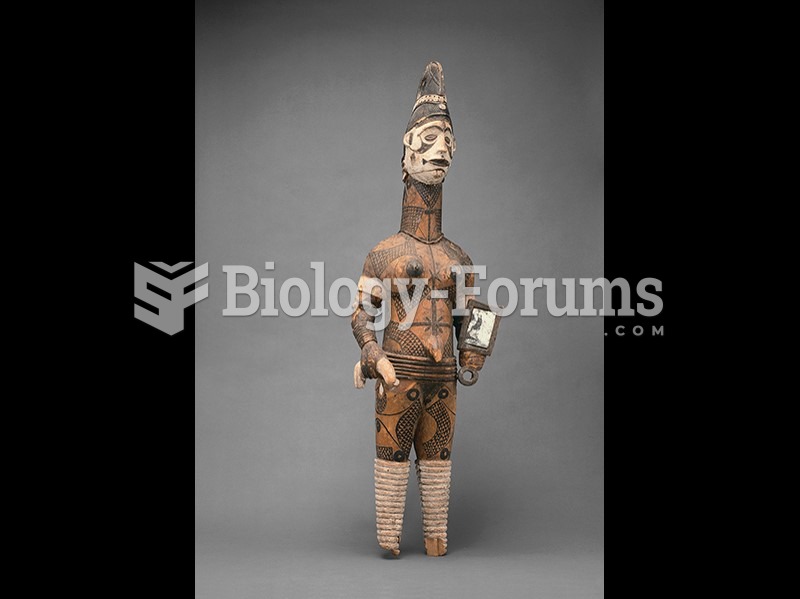 Ugonachomma display figure, Igbo, Nigeria.
 Demonstrate the Application of Triangular, Figure-Eight, and Tubular Bandages
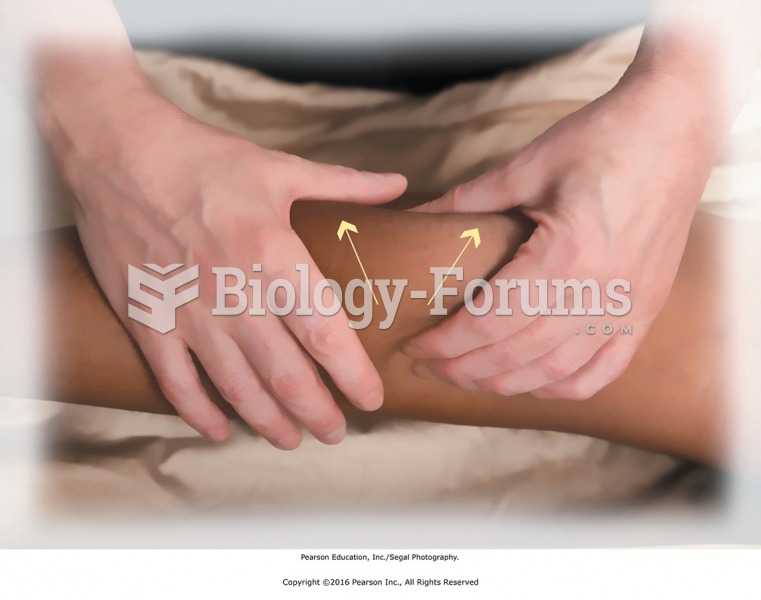 Basic two-handed kneading. Tissues are lifted with the whole hand in firm contact.
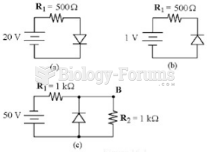 What is the current in Figure 16-1(b) if the diode is made of silicon and the polarity of the ...